Ask Your Question
1

LaTeX can't find file for text in plot

asked 2021-11-25 10:38:33 +0200

xdav gravatar image

updated 2021-11-26 08:22:14 +0200

Apologies in advance if I've missed something obvious. I'm trying to add LaTeX text to a plot, e.g.

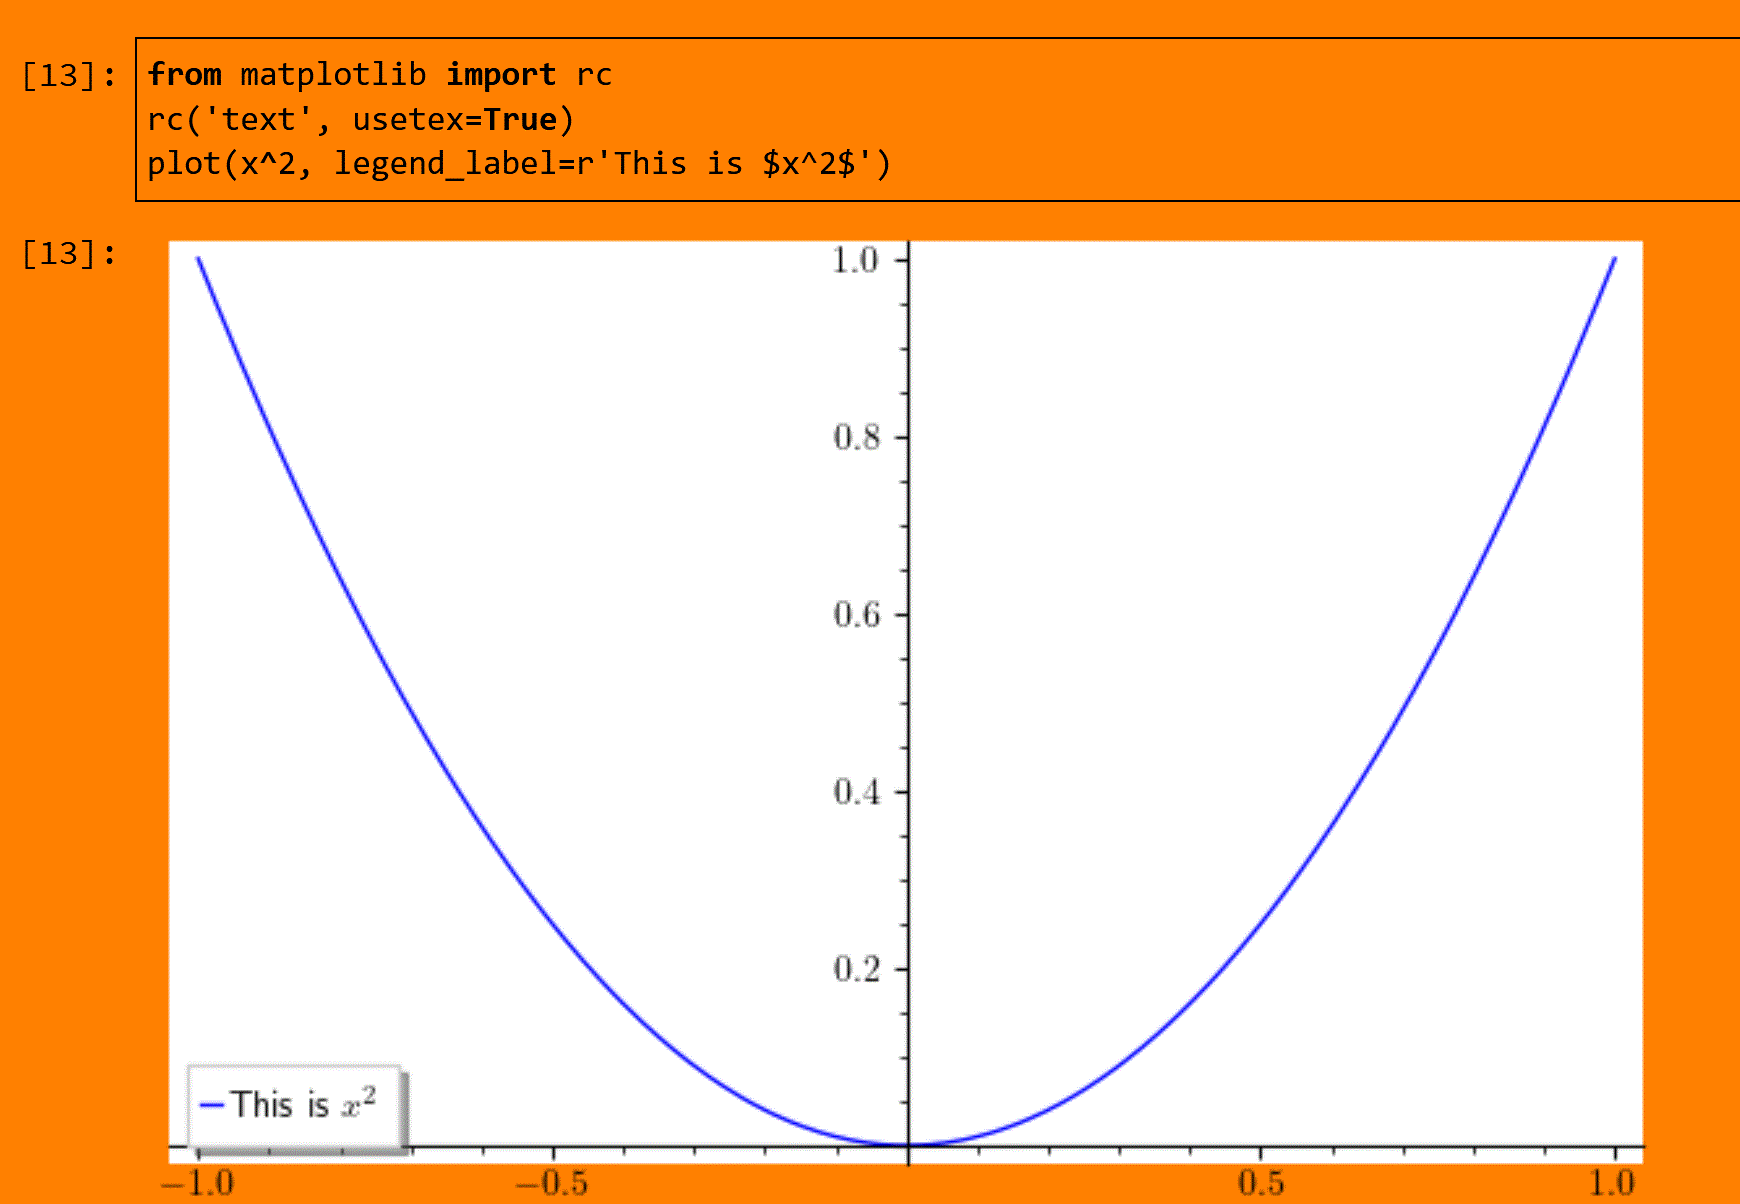
from matplotlib import rc
rc('text', usetex=True)
plot(x^2, legend_label=r'This is $x^2$')

and each time, I get an error message like this:

/opt/sagemath-9.3/local/lib/python3.7/site-packages/sage/repl/rich_output/display_manager.py:596: RichReprWarning: Exception in _rich_repr_ while displaying object: latex was not able to process the following string:
b'lp'

Here is the full report generated by latex:
This is pdfTeX, Version 3.141592653-2.6-1.40.23 (MiKTeX 21.10)
entering extended mode
! I can't find file `/home/sage/.sage/matplotlib-1.5.1/tex.cache/1acea6f6c115d0
ec7a634ed0529287b9.tex'.
<*> ....cache/1acea6f6c115d0ec7a634ed0529287b9.tex

Please type another input file name
! Emergency stop.
<*> ....cache/1acea6f6c115d0ec7a634ed0529287b9.tex

No pages of output.
Transcript written on texput.log.


  RichReprWarning,

The file in question (1acea6f6c115d0ec7a634ed0529287b9.tex) does exist, but the path is

`/home/.sage/matplotlib-1.5.1/tex.cache/1acea6f6c115d0
ec7a634ed0529287b9.tex'

not

`/home/sage/.sage/matplotlib-1.5.1/tex.cache/1acea6f6c115d0
ec7a634ed0529287b9.tex'

For whatever it's worth, my home directory is C:\Users\davis\ and if I copy the relevant file into the folder that LaTeX says it's looking for, and then run the same code, I get the same error message.

I'm on Windows 10 running Sage 9.3 (fresh installation this morning).
edit retag flag offensive close merge delete

Comments

FWIW, your code works with SageMath 9.4 running on Ubuntu 20.04. The first two lines are even not necessary to get the LaTeX output. So maybe it is an issue specific to Windows' version of Sage...

eric_g gravatar imageeric_g ( 2021-11-25 13:24:01 +0200 )edit
ortollj gravatar imageortollj ( 2021-11-25 13:48:25 +0200 )edit

The 3 codes lines generate an error also in 9.4 W10 WSL2 UBUNTU 20.04 for me , but as @eric_g remarked not the last one only, maybe something fishy here ?

@xdav : What the use of two first lines ? (just by curiosity)

ortollj gravatar imageortollj ( 2021-11-25 20:33:35 +0200 )edit

@ortollj The first two lines are because I wanted to have some non-mathematical text in a nicer font; I've edited the sample code to reflect this. The relevant tex file isn't hard to find, and it compiles ok on my system - it just gives a blank page. I did see the post you mentioned (some-latex-code-no-longer-works-in-9.3) but was reluctant to try the WSL solution because that code gives syntax errors, not file-not-found errors on my system.

xdav gravatar imagexdav ( 2021-11-26 08:36:43 +0200 )edit

1 Answer

Sort by ยป oldest newest most voted
0

answered 2021-11-27 08:03:15 +0200

ortollj gravatar image

updated 2021-11-27 09:52:28 +0200

not sure this is answering your question but now it's ok for me no more error, you just need to install like it is said here:

https://stackoverflow.com/questions/1...

sudo apt-get install dvipng texlive-latex-extra texlive-fonts-recommended cm-super

now it's ok for me in9.4 W10 WSL2 UBUNTU 20.04 , you just need to install supplementary package like it is said here

with the command :

sudo apt-get install dvipng texlive-latex-extra texlive-fonts-recommended cm-super

but there is a default \text{blabla} still does not work ;-(

test

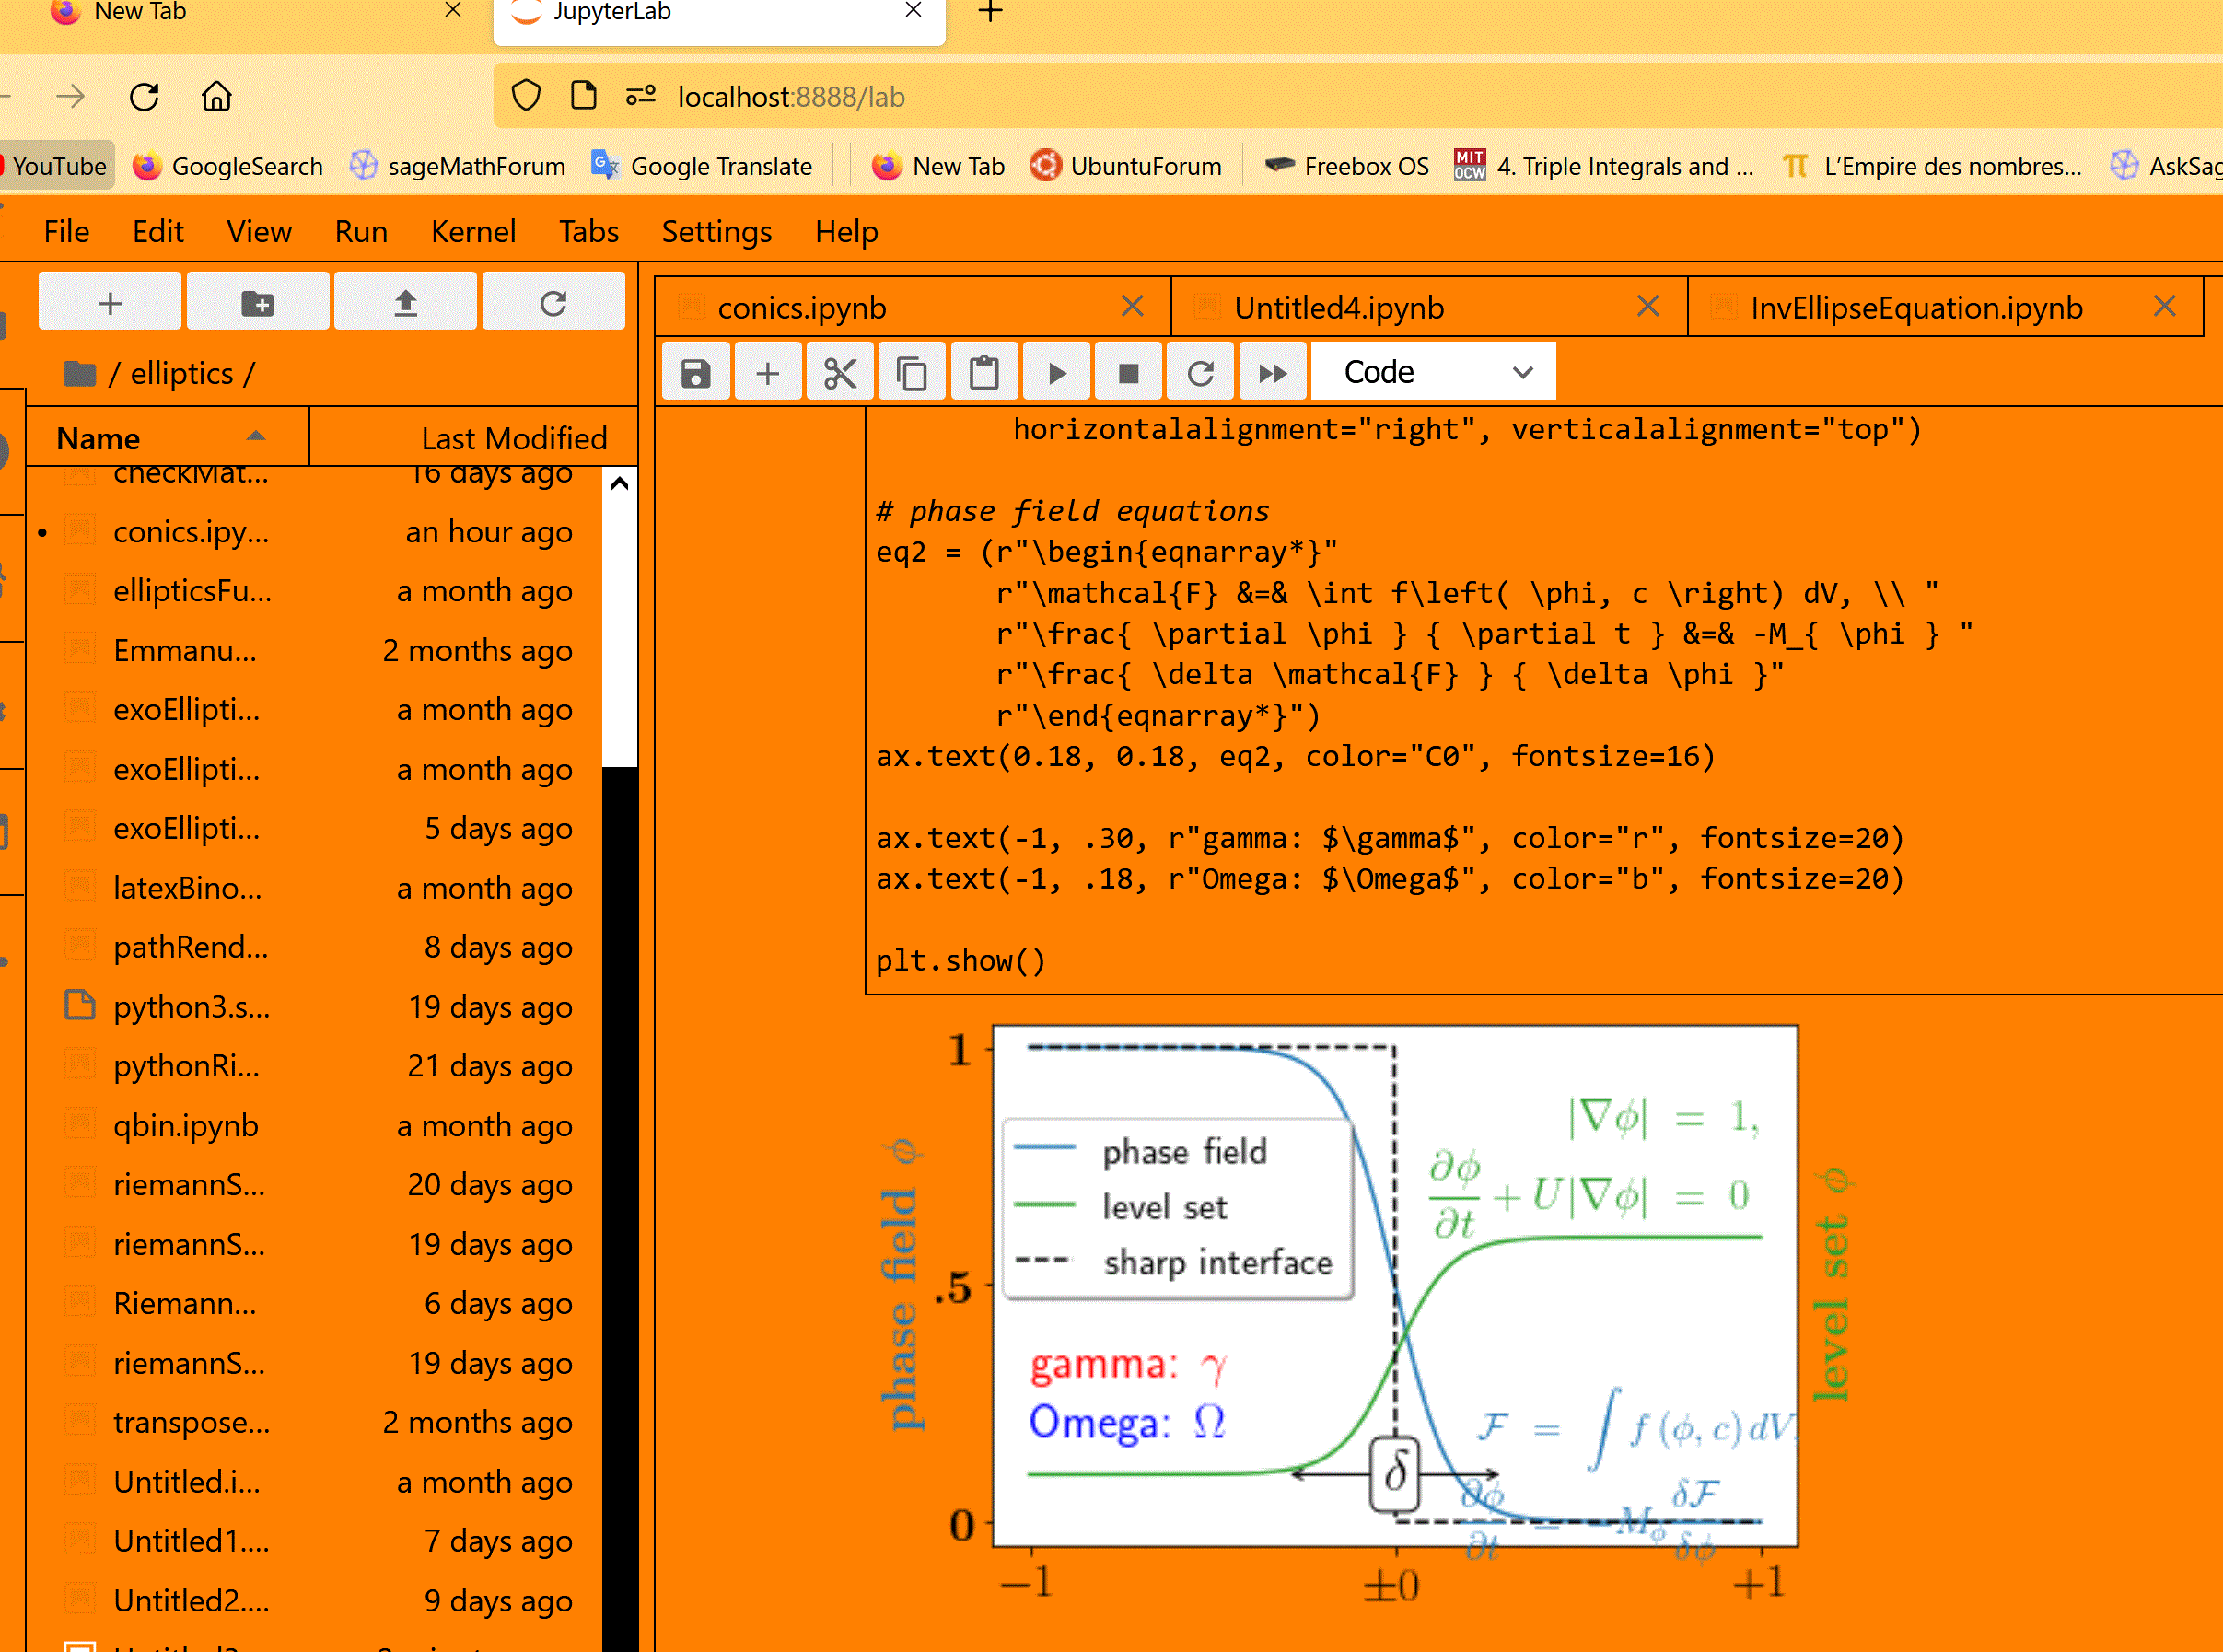
this code is now also working for me now(it was not before the new package):

fig, ax = plt.subplots()
# interface tracking profiles
N = 500
delta = 0.6
X = np.linspace(-1, 1, N)
ax.plot(X, (1 - np.tanh(4 * X / delta)) / 2,    # phase field tanh profiles
        X, (1.4 + np.tanh(4 * X / delta)) / 4, "C2",  # composition profile
        X, X < 0, "k--")                        # sharp interface

# legend
ax.legend(("phase field", "level set", "sharp interface"),
          shadow=True, loc=(0.01, 0.48), handlelength=1.5, fontsize=16)

# the arrow
ax.annotate("", xy=(-delta / 2., 0.1), xytext=(delta / 2., 0.1),
            arrowprops=dict(arrowstyle="<->", connectionstyle="arc3"))
ax.text(0, 0.1, r"$\delta$",
        color="black", fontsize=24,
        horizontalalignment="center", verticalalignment="center",
        bbox=dict(boxstyle="round", fc="white", ec="black", pad=0.2))

# Use tex in labels
ax.set_xticks([-1, 0, 1])
ax.set_xticklabels(["$-1$", r"$\pm 0$", "$+1$"], color="k", size=20)

# Left Y-axis labels, combine math mode and text mode
ax.set_ylabel(r"\bf{phase field} $\phi$", color="C0", fontsize=20)
ax.set_yticks([0, 0.5, 1])
ax.set_yticklabels([r"\bf{0}", r"\bf{.5}", r"\bf{1}"], color="k", size=20)

# Right Y-axis labels
ax.text(1.02, 0.5, r"\bf{level set} $\phi$",
        color="C2", fontsize=20, rotation=90,
        horizontalalignment="left", verticalalignment="center",
        clip_on=False, transform=ax.transAxes)

# Use multiline environment inside a `text`.
# level set equations
eq1 = (r"\begin{eqnarray*}"
       r"|\nabla\phi| &=& 1,\\"
       r"\frac{\partial \phi}{\partial t} + U|\nabla \phi| &=& 0 "
       r"\end{eqnarray*}")
ax.text(1, 0.9, eq1, color="C2", fontsize=18,
        horizontalalignment="right", verticalalignment="top")

# phase field equations
eq2 = (r"\begin{eqnarray*}"
       r"\mathcal{F} &=& \int f\left( \phi, c \right) dV, \\ "
       r"\frac{ \partial \phi } { \partial t } &=& -M_{ \phi } "
       r"\frac{ \delta \mathcal{F} } { \delta \phi }"
       r"\end{eqnarray*}")
ax.text(0.18, 0.18, eq2, color="C0", fontsize=16)

ax.text(-1, .30, r"gamma: $\gamma$", color="r", fontsize=20)
ax.text(-1, .18, r"Omega: $\Omega$", color="b", fontsize=20)

plt.show()

test

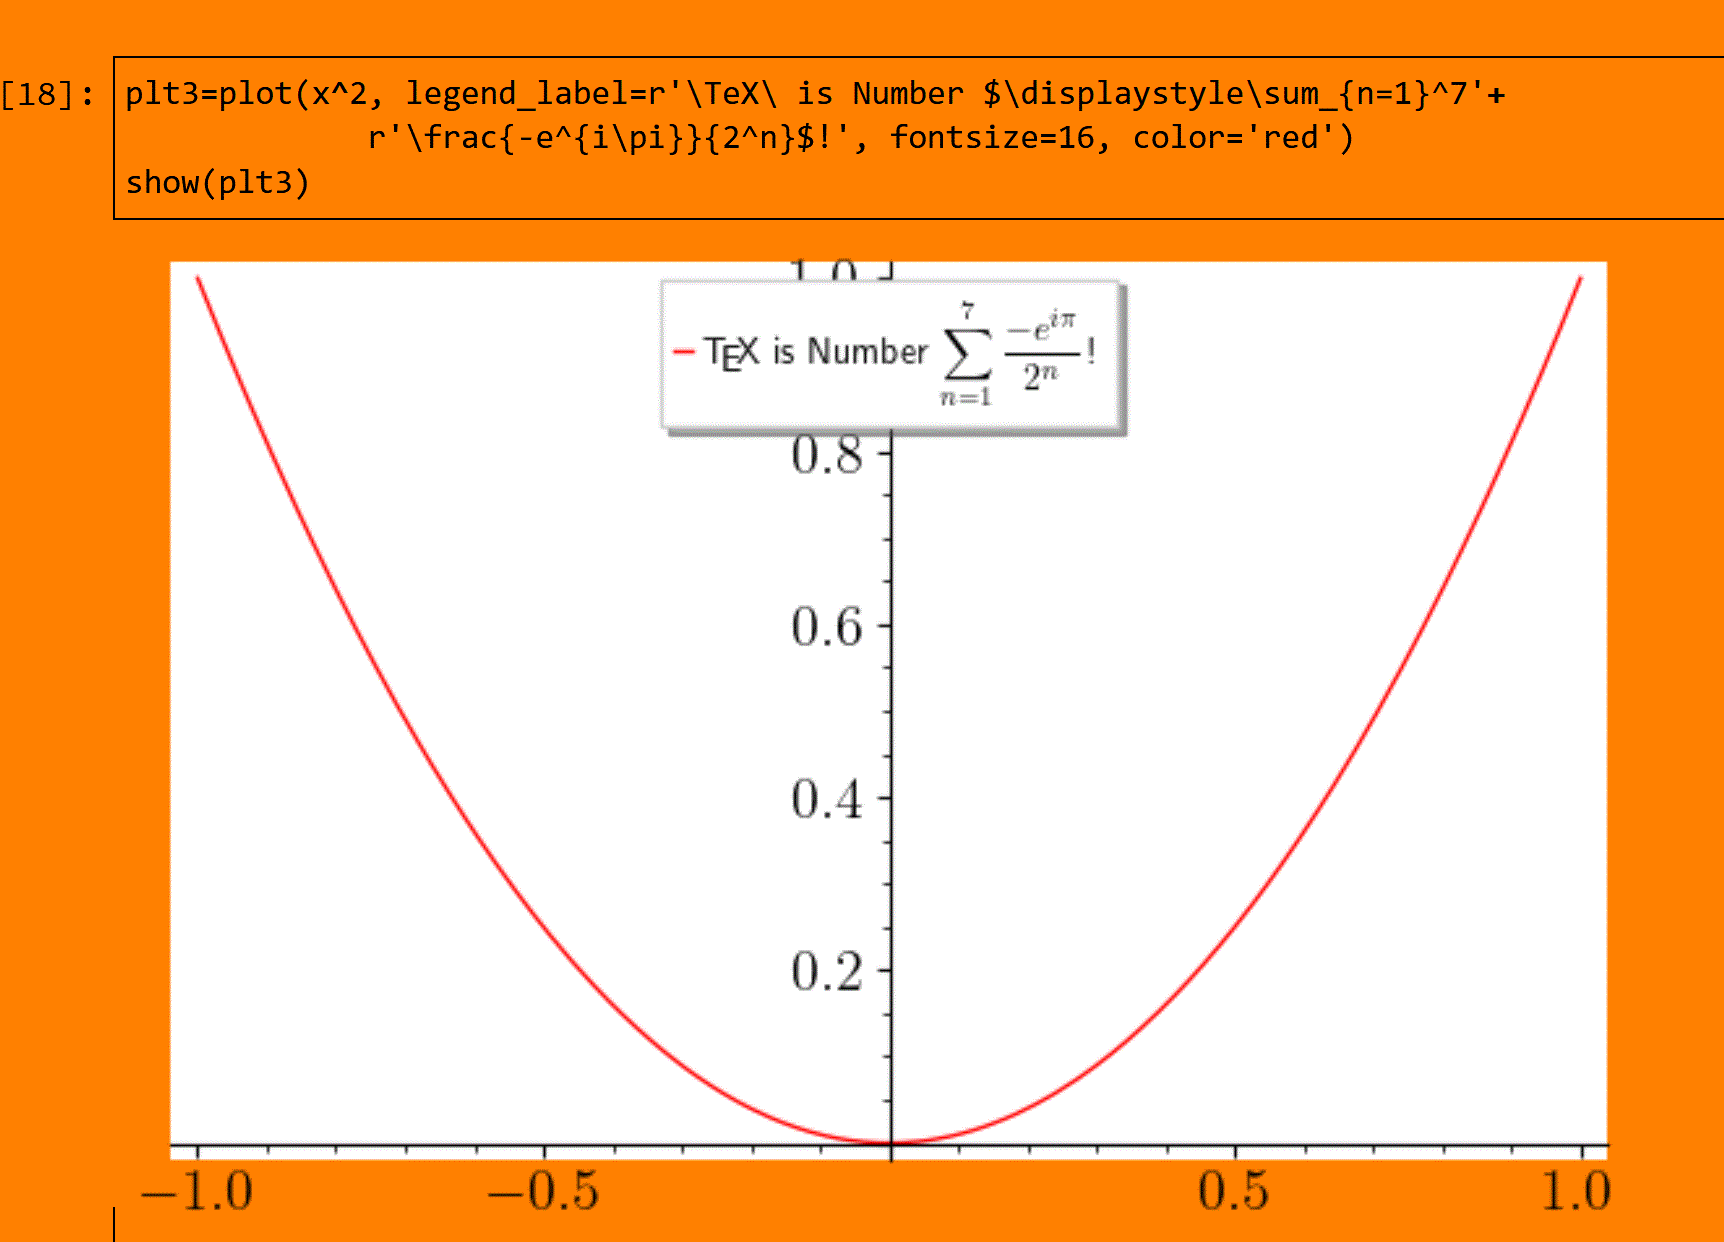
another exemple:

plt3=plot(x^2, legend_label=r'\TeX\ is Number $\displaystyle\sum_{n=1}^7'+
             r'\frac{-e^{i\pi}}{2^n}$!', fontsize=16, color='red')
show(plt3)

image description

edit flag offensive delete link more

Comments

maybe it's possible to install this package for your system 9.3 W10 with the command: sage -pip install ?

ortollj gravatar imageortollj ( 2021-11-27 08:15:42 +0200 )edit

do i have to open a ticket for this package missing ?

ortollj gravatar imageortollj ( 2021-11-27 09:54:25 +0200 )edit

The dvipng package was already installed as part of my MikTex installation (as miktex-dvipng-bin-2.9). Is it perhaps necessary to tell Sage where the package is located?

xdav gravatar imagexdav ( 2021-11-29 07:29:17 +0200 )edit

@xdav why don't you install 9.4 in Ubuntu WSL2 ? it's very easy now to install Ubuntu and WSL2, only one command in an W10 admin cmd prompt ! :

wsl.exe --install

Then follow the rest of the process described in Sandy scott page archived

Finally you can have two icons on your W10 desktop, one for SageMath Jupyter notebook and the other for SageMath Jupyter Lab.

ortollj gravatar imageortollj ( 2021-12-01 07:19:34 +0200 )edit

sorry @xdav my answer is not valid I noticed a problem of library incompatibility see the post

I will pass my answer in simple comment I tried to commute my answer in simple comment but it is not possible .

ortollj gravatar imageortollj ( 2021-12-14 10:38:01 +0200 )edit

Your Answer

Please start posting anonymously - your entry will be published after you log in or create a new account.

Add Answer

Question Tools

1 follower

Stats

Asked: 2021-11-25 10:38:33 +0200

Seen: 414 times

Last updated: Nov 27 '21