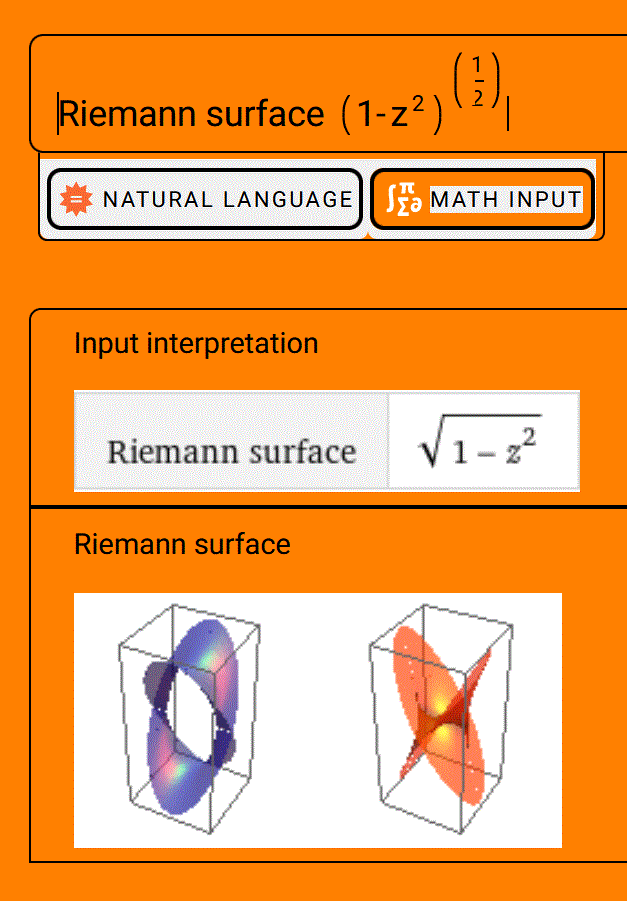
how to plot Riemann surface
Hi
I would like to plot this Riemann surface with SageMath:

I tinkered with this code below (far from being optimized!) Does it looks ok ? edited the 2022/03/14 new version on SageCell
from sage.plot.plot3d.parametric_surface import ParametricSurface
var('x,y,K,t',domain='real')
var('k',domain='integer')
K=0.9

xyBound=4 ; step=0.4 # plot parameters

def addAxis(plt,t8) :
    # add axis for real part
    plt += arrow3d((0, 0, 0), (xyBound, 0, 0), color='blue')
    plt += text3d("X", (xyBound, 0, 0), color='blue')
    plt += arrow3d((0, 0, 0), (0, xyBound, 0), color='green')
    plt += text3d("Y", (0, xyBound, 0), color='green')
    plt += arrow3d((0, 0, 0), (0, 0, xyBound), color='red')
    plt += text3d("Z", (0,0, xyBound), color='red')
    plt+=t8
    return plt

def drawF(plt,f) :
    global col
    plt+=ParametricSurface(f, (srange(-xyBound,xyBound,step),
                    srange(-xyBound,xyBound,step)), color=(col,cm),opacity=0.5, mesh=True,legend_label="toto")
    return plt

def fr0(x,y):
    z = CDF(x, y)
    zc = CDF(x, -y)
    return x, y, real_part(f(x,y))

def fr1(x,y):
    z = CDF(x, y)
    zc = CDF(x, -y)
    return x, y, -real_part(f(x,y))

def fi0(x,y):
    z = CDF(x, y)
    zc = CDF(x, -y)
    return x, y, imag_part(f(x,y))+nP*2*pi

def fi1(x,y):
    z = CDF(x, y)
    zc = CDF(x, -y)
    return x, y, -imag_part(f(x,y))-nP*2*pi


def condition(x,y,z):
    return (x*x + y*y <=1) # does not work with ParametricSurface

cm = colormaps.jet
#cm = colormaps.autumn
def col(x,y):
    if abs(x) >0 or abs(y)>0 :
        argf=acos(x/sqrt((x**2 + y**2)))/3.15
    else :
        argf=0.5
    return argf
##############################  function definition  ##############################
def f(x,y):

    z = CDF(x, y)
    zc = CDF(x, -y)
    ZDic2={Z:z,Zc:zc}
    return fZ.subs(ZDic2)

##################################################################
var('X,Y',domain='real')
var('Z',domain='complex')
var('Zc',domain='complex',latex_name=r'\overline{Z}')

u(X,Y)=X*Y^2+Y*X ;v(X,Y)=X^2*Y-Y*X
fuv(X,Y)=u(X,Y)+I*v(X,Y)

ZDic={X:(Z+Zc)/2,Y:(Z-Zc)/2}
uZ(Z,Zc)=u.subs(ZDic)
vZ(Z,Zc)=v.subs(ZDic)

#show("uZ : \t ", uZ)
#show("vZ : \t ", vZ)
#
####### choose below the function f(Z,Zc) that you want to plot Riemann surface
#  (3 graphs: 1 is real part,2 imag part 0,2*pi, 3 imag part (0,2*pi)+Np*2*pi)
fZ(Z,Zc)=uZ(Z,Zc)+I*vZ(Z,Zc)
#fZ(Z,Zc)=log(Z)
show("f(Z,Zc) :\t",fZ)
##################################################################
tr = text3d("Real part", (xyBound, xyBound, xyBound), fontsize='300%', fontweight=800) # 'extra bold'
ti = text3d("Imaginary Part", (xyBound, xyBound, xyBound), fontsize='300%', fontweight=800) # 'extra bold'
pltr=addAxis(Graphics(),tr)
plti=addAxis(Graphics(),ti)
nPmax=2
for nP in range(0,nPmax) :
    if nP==0 :
        pltr=drawF(pltr,fr0)
        pltr=drawF(pltr,fr1)
        pltr.show(viewer='threejs')
    plti+=drawF(plti,fi0)
    plti+=drawF(plti,fi1)
    if nP !=0 :
        #plti+=text3d("for -"+"2*pi <=imaginary part <="+"*2*pi",
        #         (2*xyBound, 2*xyBound, -2*xyBound),fontsize='100%',fontweight=800) # 'extra bold'
        plti+=text3d("for -"+str(nPmax+2+2)+"*pi <=imaginary part <="+str(nPmax+2+2)+"*pi",
                 (2*xyBound, 2*xyBound, -2*xyBound),fontsize='100%',fontweight=800) # 'extra bold'
    plti.show(viewer='threejs')
Asked: 2021-11-03 17:02:13 +0100
Seen: 929 times
Last updated: Mar 14 '22
 Copyright Sage, 2010. Some rights reserved under creative commons license. Content on this site is licensed under a Creative Commons Attribution Share Alike 3.0 license.