How to plot changes as a result of a parameter?
Hi,
I am new to Sage, with a Mathematica background, and am finding my way through things but am stumped on two problems and would be gladly pointed in the right direction.
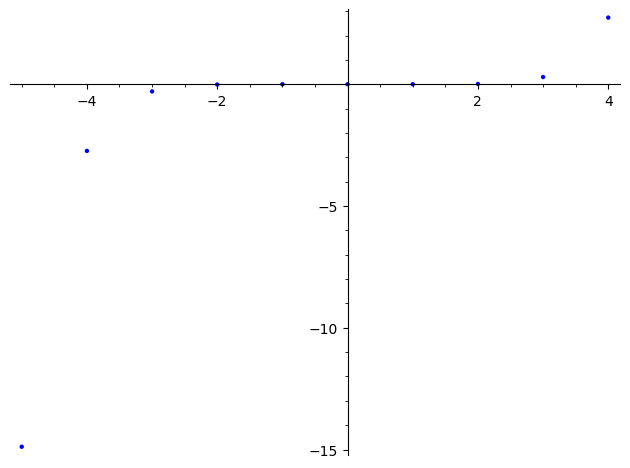
What I want to do is plot how changing a parameter, in this case k (the domain of the graph), affects the accuracy of an approximation. My definition of accuracy in this case is simply the integral of the difference of the functions, which works for the purpose I have.
a = point2d((k, N(integrate(abs(nsin(x)-sin(x)),x,-k,k))) for k in range(-5, 5))
a
I have defined nsin(x) as
nsin(x)=x-x^3/factorial(3)+x^5/factorial(5)
I would also like to be able to define an error function so that I could instead write:
error(function1, function2, xmin,xmax) = N(integrate(abs(function1-function2),x,-xmin,xmax)))
but I haven't figured out how to pass a function as an argument within a function.
Any help appreciated.
For context, I am a high school mathematics teacher and I am working with a group of enrichment students to compare the accuracy of some approximations of the Gaussian function to the analytical form.


Note e.g. for $k=-5$ you integrate from $-(-5)=5$ to $-5$ (i.e. the interval $[-5,5]$ with the reversed orientation), hence the "error" is negative; it would be reasonable to restrict to positive $k$.
Good point. We are moving towards looking at the skew normal and approximations of the skew normal, neither of which are symmetric. I can just add an abs function as needed.