Sorry, this content is no longer available

Ask Your Question
2

cannot convert log(x)/log(2) to int

asked 3 years ago

zplot gravatar image

updated 3 years ago

slelievre gravatar image

If I define J(x) function as:

def J(x):
    sum = 0
    print(int(log(x)/log(2)))
    for i in range(1, int(log(x)/log(2)) + 1):
        sum = sum + 1 / i * prime_pi(x**(1/i))
    return(N(sum))

when I try to plot it using:

p = plot(J(x), (x, 1, 20))
show(p)

I get the message:

cannot convert log(x)/log(2) to int

but if try J function acting on any float number I get a perfect value like:

sage: J(123.456789)
34.0333333333333

I have tried to replace int by floor but with the same result. Any help to solve the plotting problem will be welcome. Thank you.
Preview: (hide)

1 Answer

Sort by » oldest newest most voted
3

answered 3 years ago

slelievre gravatar image

updated 3 years ago

Many such plotting problems are solved by using a callable function or a lambda function instead of a symbolic expression.

The problem is that J(x) tries to evaluate J with the symbolic variable x as an argument, and it cannot make log(x)/log(2) an integer while x stays symbolic.

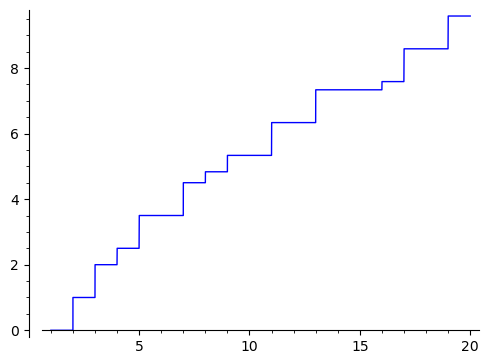
To work around that, plot using J rather than J(x):

p = plot(J, (1, 20))
p

or use a lambda function:

p = plot(lambda x: J(x), (1, 20))
p

Plot the function J with Sage

The function J could be rewritten as:

def J(x):
    return sum(1/i * prime_pi(x**(1/i))
               for i in range(1, int(log(x)/log(2)) + 1))
Preview: (hide)
link

Comments

Thank you very much, Samuel. It worked perfectly.

zplot gravatar imagezplot ( 3 years ago )

Your Answer

Please start posting anonymously - your entry will be published after you log in or create a new account.

Add Answer

Question Tools

1 follower

Stats

Asked: 3 years ago

Seen: 226 times

Last updated: Jun 29 '21