Ask Your Question
2

Plot "color_by_label" produces SQUARED number of lines in digraph

asked 4 years ago

JJ gravatar image

updated 2 years ago

tmonteil gravatar image

I bumped into this unusual behavior and am not sure how to fix it. When I add color_by_label for plotting a digraph I get the correct number SQUARED of lines appearing in the digraph. Is this an error in SageMath or is there a workaround? All monochrome lines do not work for my application.

This is my code sample:

stnc = 'ABCCCCDABCDABCDA'
g = DiGraph({}, loops=True, multiedges=True)
for a, b in [(stnc[i], stnc[i + 1]) for i in range(len(stnc) - 1)]:
    g.add_edge(a, b, b)

sage: g.edges()
[('A', 'B', 'B'), ('A', 'B', 'B'), ('A', 'B', 'B'),
 ('B', 'C', 'C'), ('B', 'C', 'C'), ('B', 'C', 'C'),
 ('C', 'C', 'C'), ('C', 'C', 'C'), ('C', 'C', 'C'),
 ('C', 'D', 'D'), ('C', 'D', 'D'), ('C', 'D', 'D'),
 ('D', 'A', 'A'), ('D', 'A', 'A'), ('D', 'A', 'A')]

# This produces the correct number of lines SQUARED
g.plot(color_by_label=True, edge_style='solid', layout='circular').show(figsize=(8, 8))

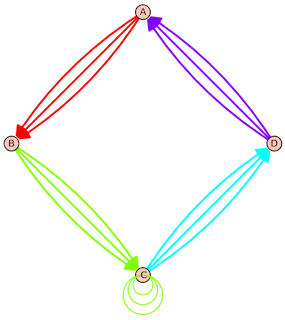
# Correct number of lines but monochrome
g.plot(layout='circular').show(figsize=(8, 8))

Incorrect edge multiplicity for multidigraph with color_by_label

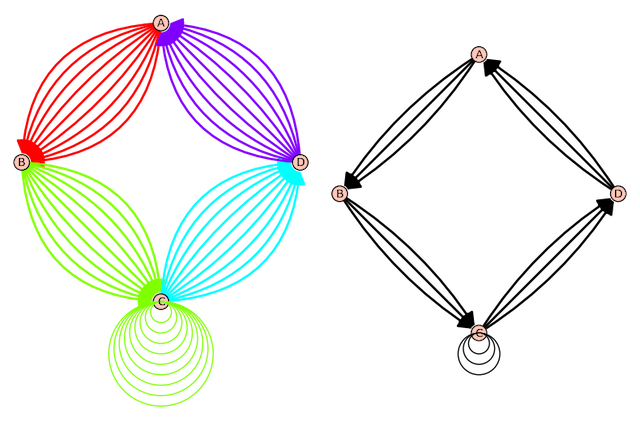
Each edge should have multiplicity 3. In the plot with color edges, each has multiplicity 9. The plot with no colors has correct multiplicity 3 for each edge.

Preview: (hide)

Comments

I'm curious what the name "stnc" stands for... Could you explain?

slelievre gravatar imageslelievre ( 3 years ago )

1 Answer

Sort by » oldest newest most voted
2

answered 4 years ago

slelievre gravatar image

updated 4 years ago

That is a bug. I think the faulty lines of code are

Fixing this is now tracked at


Edit. The ticket now has fix and positive review. Hopefully it will be part of the next Sage release.

If you installed Sage 9.2 or later from source or from binaries (rather than "via a package manager"), you can apply the fix to your current Sage installation by running the following commands in a terminal:

$ cd $(sage -c "print(SAGE_ROOT)")
$ git remote add trac git://trac.sagemath.org/sage.git -t develop
$ git checkout -b 31542
$ git pull trac u/chapoton/31542
$ ./sage -b

Next time you start Sage, it should have the fix.

Correct plot of multiedge digraph

Preview: (hide)
link

Comments

Thank you so much for the excellent feedback and quick response. Based on your instructions I created a SabeMath 9.2 install from the source in a Linux virtual machine and then applied the patch. Everything worked fine.

JJ gravatar imageJJ ( 4 years ago )

The fix was merged in SageMath 9.4.beta0, so starting with that version the graph is correct.

slelievre gravatar imageslelievre ( 3 years ago )

Your Answer

Please start posting anonymously - your entry will be published after you log in or create a new account.

Add Answer

Question Tools

1 follower

Stats

Asked: 4 years ago

Seen: 741 times

Last updated: Mar 24 '21