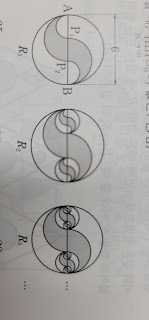
The following code may help to get one of the pictures:
def figure(c,r,z):
    fig = circle((c,0), r, facecolor="white", edgecolor="black", fill=True, zorder=z)
    fig += disk((c+r/3,0), 2*r/3, (0,pi), color="lightgray", zorder=z+1)
    fig += arc((c+r/3,0), 2*r/3, sector=(0,pi), color="black", zorder=z+1)
    fig += disk((c-r/3,0), 2*r/3, (pi,2*pi), color="lightgray", zorder=z+1)
    fig += arc((c-r/3,0), 2*r/3, sector=(pi,2*pi), color="black", zorder=z+1)
    fig += disk((c+2*r/3,0), r/3, (0,pi), color="white", zorder=z+2)
    fig += arc((c+2*r/3,0), r/3, sector=(0,pi), color="black", zorder=z+2)
    fig += disk((c-2*r/3,0), r/3, (pi,2*pi), color="white", zorder=z+2)
    fig += arc((c-2*r/3,0), r/3, sector=(pi,2*pi), color="black", zorder=z+2)
    fig += line([(c-r,0),(c+r,0)], color="black", zorder=z+2)
    return fig
centers = [[2/3], [4/9, 8/9], [10/27,14/27,22/27,26/27]]
radii = [1/3, 1/9, 1/27]
zs = [5, 10, 15]
r = 3
R = figure(0,r,0)
show(R, axes=False)
for i in [0,1,2]:
    for c in centers[i]:
        R += figure(-c*r,radii[i]*r,zs[i]) + figure(c*r,radii[i]*r,zs[i])
    show(R, axes=False)
See this SageMath cell for the output.


I don' know why https:// were missing in front of the two url ?.
first image
second image
Edited the question to turn the urls into image links. Not sure how to rotate by a quarter turn. Maybe the original poster can upload rotated pictures somewhere.