Ask Your Question
1

How to change the gridlines dimension?

asked 2021-02-21 15:48:44 +0200

krrish0150 gravatar image

plot(f, (x, 0.1, 1), figsize= 4, color= 'green', gridlines =True)

I want to use the change the default gridline spacing! And add a proper box at the all the 4 edges of the Plot. Could someone help ? Thanks

edit retag flag offensive close merge delete

Comments

Welcome to Ask Sage! Thank you for your question.

slelievre gravatar imageslelievre ( 2021-02-21 15:58:25 +0200 )edit

Please provide code that can be pasted in a fresh Sage session to illustrate the question.

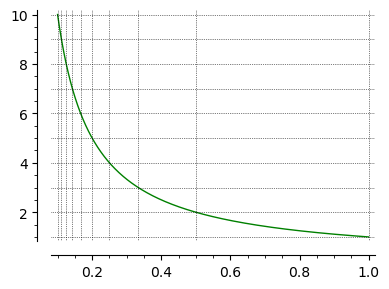
Such as it is now, the code gives:

NameError: name 'f' is not defined
slelievre gravatar imageslelievre ( 2021-02-21 15:59:47 +0200 )edit

1 Answer

Sort by ยป oldest newest most voted
0

answered 2021-02-21 16:16:00 +0200

slelievre gravatar image

updated 2021-02-21 16:18:01 +0200

I typed "grid" in Ask Sage's "search or ask your question" box.

Some related questions and answers were suggested.

Many had useful tips and examples.

Instead of True, gridlines can be set to [xx, yy] where xx and yy are gridlines coordinate lists.

Example:

sage: f = lambda x: 1/x
sage: plot(f, (0.1, 1), color='green', gridlines=[[1/n for n in (10, 9 .. 1)], [1 .. 10]])

SageMath plot with hand picked gridlines

To get a box around the picture, use frame=True.

edit flag offensive delete link more

Comments

Thank you sir :)

krrish0150 gravatar imagekrrish0150 ( 2021-02-23 14:23:15 +0200 )edit

If this solves your problem, you can accept the answer.

For that, click the "check" mark near the top left of the answer.

This will mark your question as solved in the list of questions.

slelievre gravatar imageslelievre ( 2021-02-23 20:21:45 +0200 )edit

Your Answer

Please start posting anonymously - your entry will be published after you log in or create a new account.

Add Answer

Question Tools

Stats

Asked: 2021-02-21 15:48:44 +0200

Seen: 440 times

Last updated: Feb 21 '21