Ask Your Question
1

Drawing polyominoes

asked 2020-12-02 14:34:58 +0100

Rafik gravatar image

How can I write a function which takes a list of coordinates and draws the corresponding polyomino? To draw something like a rectangle I wrote the following:

def drawRectangle(A,B): return polygon([(A[0], A[1]), (A[0], B[1]), (B[0], B[1]), (B[0], A[1])])

But imagine if we have a bigger figure, how can I do this without using polygon? So how can I write a function which takes a list of coordinates and draws its polyomino? For example [(0,0), (0,1), (1,1), (1,2)] is equivalent with a tetromino.
edit retag flag offensive close merge delete

Comments

Welcome to Ask Sage!

Thank you for your question.

slelievre gravatar imageslelievre ( 2020-12-02 15:21:52 +0100 )edit

To display blocks of code or error messages in Ask Sage, skip a line above and below, and do one of the following (all give the same result):

  • indent all code lines with 4 spaces
  • select all code lines and click the "code" button (the icon with '101 010')
  • select all code lines and hit ctrl-K

For instance, typing

If we define `f` by

    def f(x, y, z):
        return x * y * z

then `f(2, 3, 5)` returns `30` but `f(2*3*5)` gives:

    TypeError: f() takes exactly 3 arguments (1 given)

produces:

If we define f by

def f(x, y, z):
    return x * y * z

then f(2, 3, 5) returns 30 but f(2*3*5) gives:

TypeError: f() takes exactly 3 arguments (1 given)

Please edit your question to do that.

slelievre gravatar imageslelievre ( 2020-12-02 15:22:21 +0100 )edit

1 Answer

Sort by ยป oldest newest most voted
1

answered 2020-12-02 15:23:20 +0100

slelievre gravatar image

updated 2020-12-02 15:25:23 +0100

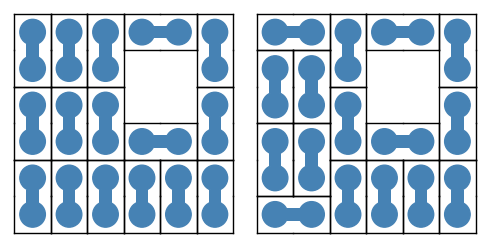
Sage has a built-in class of polyominos, with some solving and plotting functions.

Here is an example.

Some preliminary imports.

sage: import itertools
sage: from sage.combinat.tiling import TilingSolver, Polyomino

Define a polyomino and a chessboard.

sage: domino = Polyomino([(0, 0), (1, 0)], color='steelblue')
sage: s = set(itertools.product(range(6), repeat=2))
sage: s.difference_update([(3, 3), (3, 4), (4, 3), (4, 4)])
sage: chessboard = Polyomino(s)

Define the tiling problem.

sage: T = TilingSolver([domino], box=chessboard, reflection=False, rotation=True, reusable=True)

Count solutions.

sage: T.number_of_solutions()

Store the solutions in a list.

sage: solutions = list(T.solve())

Turn two of the solutions into graphic objects.

sage: G = sum([piece.show2d() for piece in solutions[0]], Graphics())
sage: GG = sum([piece.show2d() for piece in solutions[220]], Graphics())

Save them to file, or view them.

sage: graphics_array([G, GG]).save("domino-tilings.png", aspect_ratio=1, axes=False)
sage: graphics_array([G, GG]).show(aspect_ratio=1, axes=False, figsize=5)

Polyomino tiling: domino tiling

edit flag offensive delete link more

Your Answer

Please start posting anonymously - your entry will be published after you log in or create a new account.

Add Answer

Question Tools

Stats

Asked: 2020-12-02 14:34:58 +0100

Seen: 606 times

Last updated: Dec 02 '20