First time here? Check out the FAQ!

Ask Your Question
2

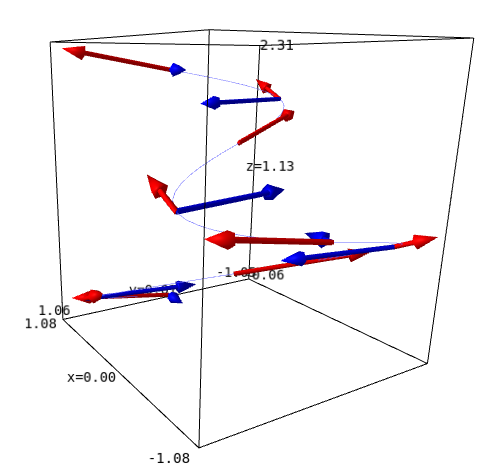
Plot velocity and acceleration vectors of a space curve

asked 4 years ago

PolarizedIce gravatar image

updated 4 years ago

slelievre gravatar image

I'm having trouble plotting the velocity and acceleration vectors of the following space curve (r3).

May anyone help guide me in the right direction to solve this problem?

var('t')
r3(t) = (cos(t/2), sin(t), t/6)
v3 = diff(r3(t),t)
a3 = diff(v3,t)
curve3 = parametric_plot3d(r3(t),(t,0,4*pi),thickness=0.5)
velvecs = Graphics()
accvecs = Graphics()
for k in range(9):
    velvecs += arrow(r3(k*pi/2),r3(k*pi/2)+v3(k*pi/2),color='red') #Line 26
    accvecs += arrow(r3(k*pi/2),r3(k*pi/2)+a3(k*pi/2),color='blue')
show(velvecs+accvecs+curve3,axes=False)
Preview: (hide)

1 Answer

Sort by » oldest newest most voted
2

answered 4 years ago

rburing gravatar image

updated 4 years ago

The problem is that calling v3(k*pi/2) will try to call each component of v3 with that positional argument, but the last component of v3 is 1/6, so calling it with a positional argument is not supported. You can call it with a keyword argument instead, by using v3(t=k*pi/2). To be even more explicit, you can write v3.subs(t=k*pi/2). Similarly for a3.

Or, what you probably meant to do: make v3 callable too:

v3 = diff(r3,t)
a3 = diff(v3,t)

With both approaches, your code works:

space curve

Preview: (hide)
link

Your Answer

Please start posting anonymously - your entry will be published after you log in or create a new account.

Add Answer

Question Tools

1 follower

Stats

Asked: 4 years ago

Seen: 679 times

Last updated: Nov 20 '20