Ask Your Question
1

Braces inside a plot

asked 2020-11-06 18:37:41 +0200

Cyrille gravatar image

I would like to have a nice brace in front of the $x$ but this is ugly

var('R')
p=1/2

pl=plot(p^3*R,(R,0,10),axes_labels=['$R$',''],legend_label='$p^3*R$',ticks=[[], []])
pl+=plot((1/(1-(1-(1/p))^3))*R,(R,0,10),rgbcolor="red",legend_label='$(1/(1-(1-(1/p))^3)*R$',ticks=[[], []])
pl+=line([(6,p^3*6), (6,(1/(1-(1-(1/p))^3))*6)],rgbcolor="green",ticks=[[], []],thickness=3)
pl+=line([(0,p^3*6), (0,(1/(1-(1-(1/p))^3))*6)],rgbcolor="green",ticks=[[], []],thickness=3)
pl+=line([(6,0), (6,p^3*6)],rgbcolor="green",linestyle="--" ,ticks=[[], []])
pl+=line([(0,p^3*6), (6,p^3*6)],rgbcolor="green",linestyle="--",ticks=[[], []])
pl+=line([(0,(1/(1-(1-(1/p))^3))*6), (6,(1/(1-(1-(1/p))^3))*6)],rgbcolor="green",linestyle="--",ticks=[[], []] )
pl+=text("Ligne de prix maximal à l'achat", (8,4.2), rotation=37.0,rgbcolor="red")
pl+=text("Ligne de prix minimal à la vente", (8.5,1.2), rotation=10.0,rgbcolor="blue")
pl+=text("$\\left\\{\\right.$", (1.2,-.2), fontsize=60)
pl+=text("$R$", (6,-.2))
pl+=text("$x$", (-.2,2))
show(pl,ticks=[[], []])
edit retag flag offensive close merge delete

Comments

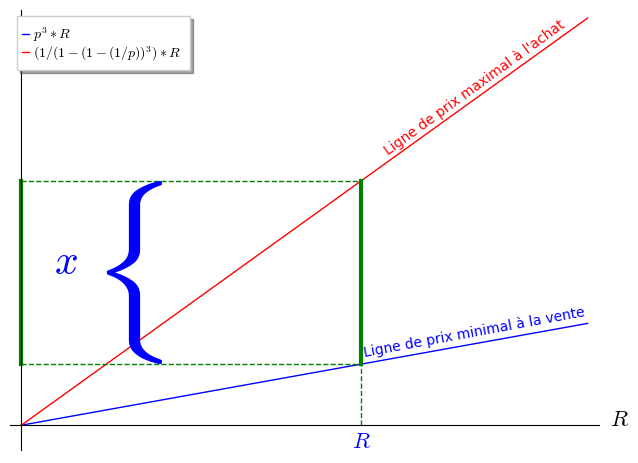
When I run the code, the brace is nowhere near the $x$ label. Where do you want the brace exactly?

rburing gravatar imagerburing ( 2020-11-10 22:46:49 +0200 )edit

1 Answer

Sort by » oldest newest most voted
0

answered 2021-01-01 00:21:08 +0200

slelievre gravatar image

Here is a version with the brace at the right location.

Is that what you want or is that what you would call ugly?

Maybe you want a thinner brace?

sage: var('R')
sage: p = 1/2
sage: pp = p^3
sage: qq = 1/(1-(1-(1/p))^3)
sage: pp6 = pp*6
sage: qq6 = qq*6
sage: opt = {'ticks': [[], []], 'axes_labels': ['$R$', '']}
sage: g = plot(p^3*R, (R, 0, 10), legend_label='$p^3*R$', **opt)
sage: g += plot(qq*R, (R, 0, 10), color="red", legend_label='$(1/(1-(1-(1/p))^3)*R$', **opt)
sage: g += line([(6, pp6), (6, qq6)], color="green", thickness=3, **opt)
sage: g += line([(0, pp6), (0, qq6)], color="green", thickness=3, **opt)
sage: g += line([(6, 0), (6, pp6)], color="green", linestyle="--", **opt)
sage: g += line([(0, pp6), (6, pp6)], color="green", linestyle="--", **opt)
sage: g += line([(0, qq6), (6, qq6)], color="green", linestyle="--", **opt)
sage: g += text("Ligne de prix maximal à l'achat", (8, 4.15), rotation=36.0, color="red")
sage: g += text("Ligne de prix minimal à la vente", (8, 1.15), rotation=10.5, color="blue")
sage: g += text(r"$\left\{\right.$", (2.5, 1.515), fontsize=110, horizontal_alignment='right')
sage: g += text("$R$", (6, -.2), fontsize=16)
sage: g += text("$x$", (1, 2), fontsize=30, horizontal_alignment='right')
sage: show(g, **opt)

Graphics with maximum buying price and minimum selling price

edit flag offensive delete link more

Your Answer

Please start posting anonymously - your entry will be published after you log in or create a new account.

Add Answer

Question Tools

1 follower

Stats

Asked: 2020-11-06 18:37:41 +0200

Seen: 271 times

Last updated: Jan 01 '21