Ask Your Question
1

Plot the solution of a system of equations

asked 2020-10-21 12:07:25 +0100

geroyx gravatar image

With

a,b,c,d,e,x = var('a b c d e x')
f(x)=a*x^4+b*x^3+c*x^2+d*x+e
f1(x)=diff(f(x),x)
f2(x)=diff(f(x),x,2)
solve([f(0)==-3, f(2)==0, f2(4)==0, f1(6)==0, f(6)==4], a,b,c,d,e)

I get [[a == (-7/432), b == (43/216), c == (-5/6), d == (5/2), e == -3]]

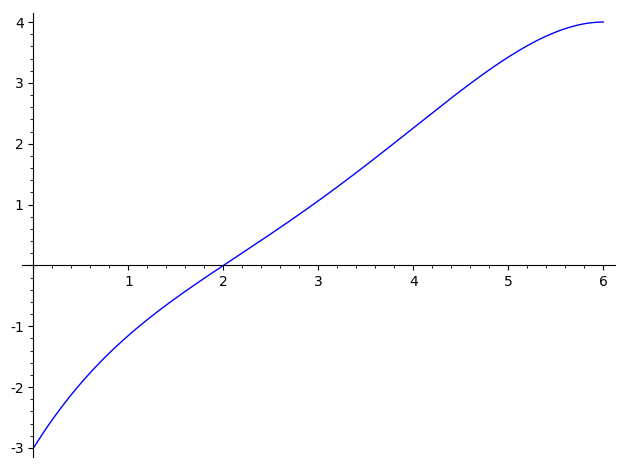
How can I plot f(x) with these values?

edit retag flag offensive close merge delete

1 Answer

Sort by ยป oldest newest most voted
2

answered 2020-10-21 12:26:31 +0100

rburing gravatar image
sols = solve([f(0)==-3, f(2)==0, f2(4)==0, f1(6)==0, f(6)==4], a,b,c,d,e)
plot(f.subs(sols[0]),(x,0,6))

image description

edit flag offensive delete link more

Comments

TYVM. Helps me good. ;)

geroyx gravatar imagegeroyx ( 2020-10-21 12:56:23 +0100 )edit

Your Answer

Please start posting anonymously - your entry will be published after you log in or create a new account.

Add Answer

Question Tools

1 follower

Stats

Asked: 2020-10-21 12:07:25 +0100

Seen: 272 times

Last updated: Oct 21 '20