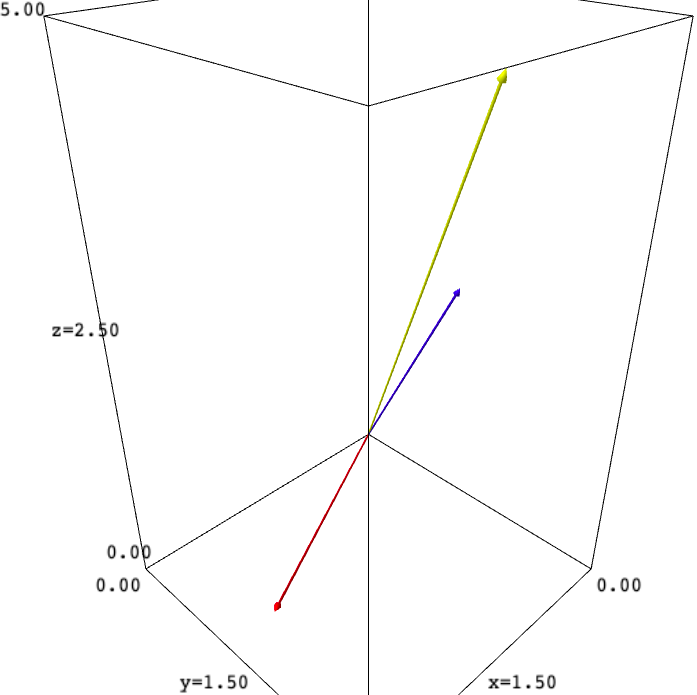
Plot for vectors
V1 = vector([3,2,1])
V2 = vector([2,3,5])
V3 = vector([1,2,3])

plot(V1, color='red', gridlines='minor') + plot(V2, color='yellow') + plot(V3, color='blue')
What's up with the graph? Why are the lines not shown as vectors and why do they not change color?


What operating system? What version of Sage? Based on Python 2 or Python 3? How was it installed? Is this using the Sage REPL or SageNB or Jupyter or other? On a computer or on SageCell or on CoCalc?
Sage 9.0 on Ubuntu 20.04. Guess I gotta change vers.
Indeed, the issue has been fixed in Sage 9.1, cf. the ticket #29206 and these 9.1 release tour notes.
When observing a problem in a Sage version older than the latest stable version, trying the code on SageCell provides a good hint whether the problem is solved, since it gets upgraded quite fast every time a stable version is released. (Many thanks to the maintainer for that!)
Noted. I upgraded and it works. Thanks alot.