Ask Your Question
1

plot_vector_field3d in spherical coordinates

asked 2020-07-04 12:48:23 +0200

curios_mind gravatar image

updated 2024-04-16 21:16:47 +0200

FrédéricC gravatar image

Hello,

How can I draw a vector field in spherical coordinates?

For example

E=EuclideanSpace(3)
c_cart.<x,y,z>=E.cartesian_coordinates()
c_spher.<r,ph,th>=E.spherical_coordinates()

f_spher=E.frames()[2] # frame in spherical coordinates
E.set_default_chart(c_spher)
E.set_default_frame(f_spher) 

vf=E.vectorfield((r,0,0), frame=f_spher,cart=c_spher,name="vf");show(vf.display())

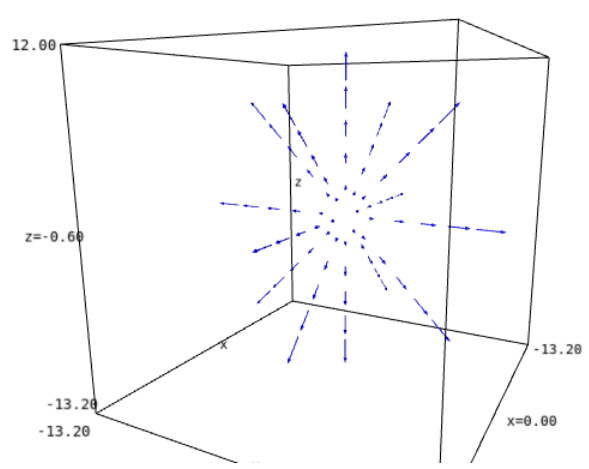
This beutifully gives me a vector field as r e_r

Now, I would like to plot this field in spherical coordinates

plot_vector_field3d([c.expr() for c in vf[:]], (r,2,10),(th,0,pi),(ph,0,2*pi))

I also tried out the transformation keyword as it is in plot3d function, but it still plots r as x. How can I plot the vector field in spherical coordinates? I was expecting to see outgoing arrows in all directions from r=2 to 10?

edit retag flag offensive close merge delete

1 Answer

Sort by » oldest newest most voted
1

answered 2020-07-05 14:43:48 +0200

eric_g gravatar image

updated 2020-07-05 14:49:00 +0200

Instead of plot_vector_field3d, use the method plot of vector fields:

vf.plot(chart=c_cart, chart_domain=c_spher, ranges={r: (2, 10)}, scale=0.2, width=2)

The output is

image description

See the documentation of VectorField.plot() for explanations and more examples.

Side note: there are some typos in your example (E.vectorfield --> E.vector_field, cart --> chart); it should read

vf = E.vector_field((r,0,0), frame=f_spher, chart=c_spher, name="vf")

Besides, instead of f_spher = E.frames()[2], you can use f_spher = E.spherical_frame().

edit flag offensive delete link more

Comments

Thank you so much.

Yep, I made typos. Sorry for that. The code was on another computer, I was typing it it.

curios_mind gravatar imagecurios_mind ( 2020-07-05 22:29:52 +0200 )edit

Is there a way to increase density of the vectors? It is also very slow. Is there a way to speed it up?

curios_mind gravatar imagecurios_mind ( 2020-07-06 20:18:16 +0200 )edit

To increase the density of vectors, use the optional argument number_values, for instance number_values=9; see the documentation of VectorField.plot(). Yes the plot is slow and there is room for improvement. This is on my todo list...

eric_g gravatar imageeric_g ( 2020-07-09 10:39:59 +0200 )edit

Your Answer

Please start posting anonymously - your entry will be published after you log in or create a new account.

Add Answer

Question Tools

1 follower

Stats

Asked: 2020-07-04 12:48:23 +0200

Seen: 481 times

Last updated: Jul 05 '20