Consider the following code:
from sage.plot.plot3d.index_face_set import IndexFaceSet
from sage.plot.plot3d.texture import Texture

def project_xy_xz_yz(surf, position):
    oxy,oxz,oyz = position

    # Initialize surf as an IndexFaceSet
    surf.triangulate()

    # Vertices projected onto planes parallel to xy, xz and yz
    vxy_list = [(v[0],v[1],oxy) for v in surf.vertices()]
    vxz_list = [(v[0],oxz,v[2]) for v in surf.vertices()]
    vyz_list = [(oyz,v[1],v[2]) for v in surf.vertices()]

    # Compute projections. We have to consider whether or not
    # each face has its own color
    f_list = surf.index_faces()
    if surf.has_local_colors():
        f_data = surf.index_faces_with_colors()
        col_list = [Texture(color=item[1]) for item in f_data]
        pxy = IndexFaceSet(f_list,vxy_list,texture_list=col_list)
        pxz = IndexFaceSet(f_list,vxz_list,texture_list=col_list)
        pyz = IndexFaceSet(f_list,vyz_list,texture_list=col_list)
    else:
        texture = surf.get_texture()
        pxy = IndexFaceSet(f_list,vxy_list)
        pxy.set_texture(texture)
        pxz = IndexFaceSet(f_list,vxz_list)
        pxz.set_texture(texture)
        pyz = IndexFaceSet(f_list,vyz_list)
        pyz.set_texture(texture)

    # End function
    return [pxy, pxz, pyz]
This code defines a function, project_xy_xz_yz, which computes the projection of a surface, given by the first argument, onto planes parallel to the $xy-$, $xz-$ and $yz-$planes. Specifically, if the second argument is [a,b,c], we get the projections onto the planes $z=a$, $y=b$ and $x=c$. The functions used in the code are mostly documented here.
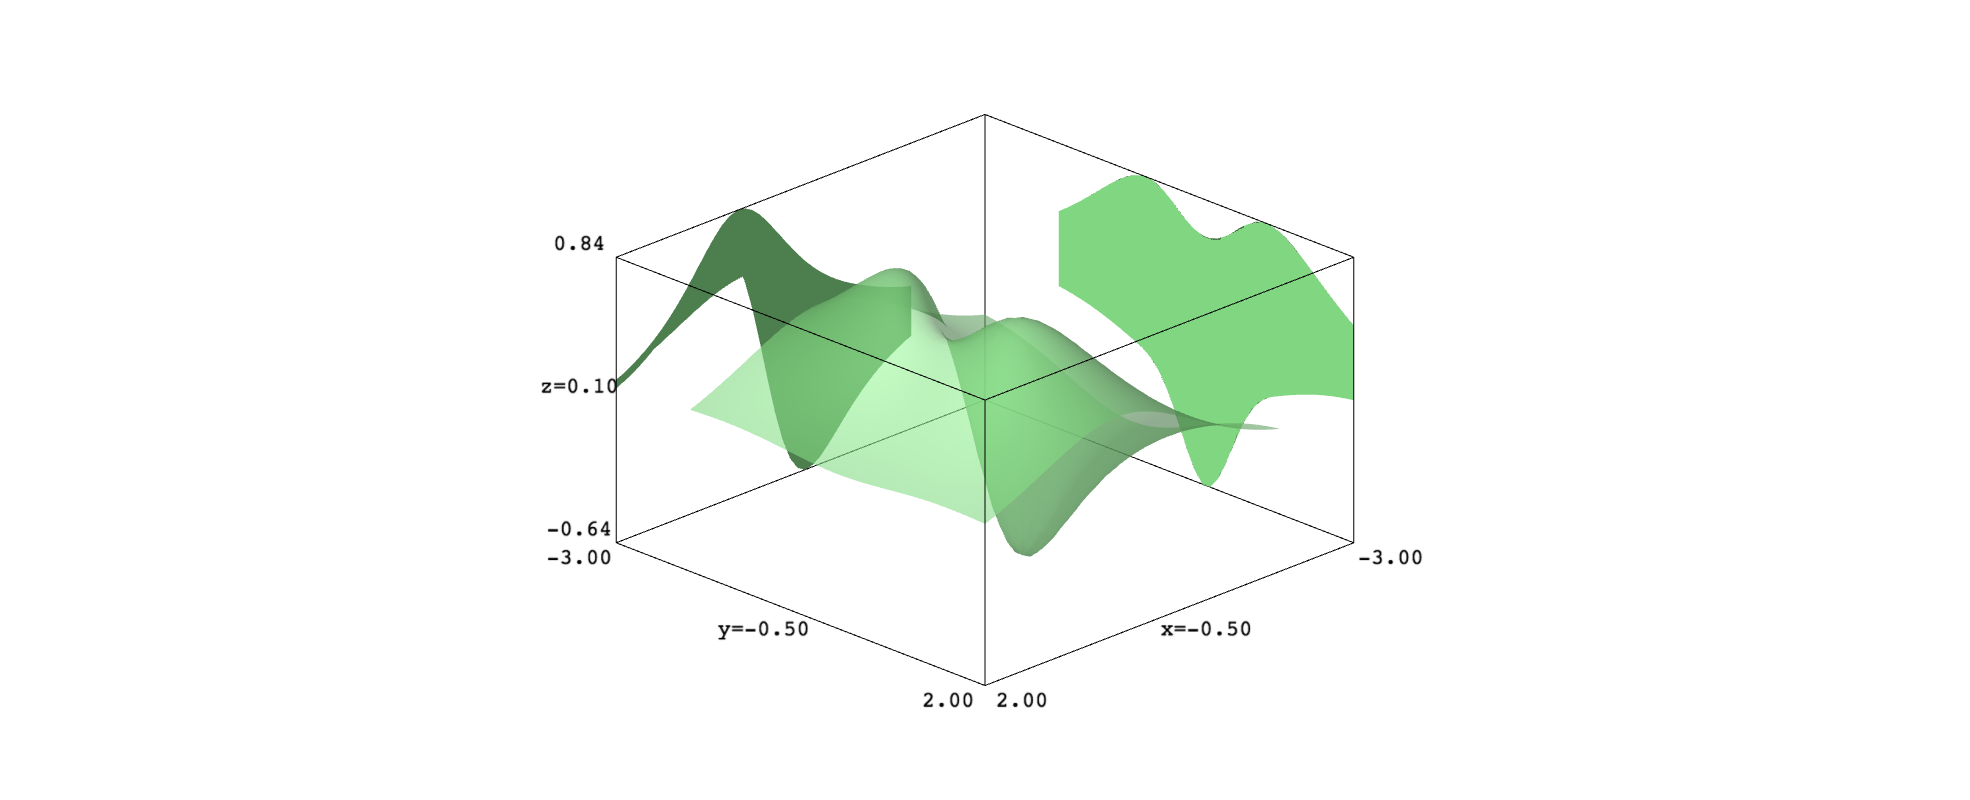
Let us test this function. Let us consider the surface
$$
z=\frac{2x+3y^2}{(x^2+y^2+1)^2}
$$
and plot it in the rectangle $[-2,2]\times[-2,2]$. First, the surface will have a uniform color and will be a bit transparent. We add the projections onto planes parallel to $xz$ and $yz$, which inherit the surface color. The orthographic projection will allow you to check that the projections match the surface.
var("x,y")
def f(x,y):
    return (2*x+3*y^2) / (x^2+y^2+1)^2

s1 = plot3d(f(x,y), (x,-2,2), (y,-2,2), color="lightgreen", opacity=0.6)
p1 = project_xy_xz_yz(s1,[-1,-3,-3])
show(s1+p1[1]+p1[2], aspect_ratio=[1,1,2], projection="orthographic")
Now, let us get a full color picture and the three projections. Note that you can freely choose where locate the projection planes.
z1, z2 = -0.6, 0.8
def col(x,y):
    return float((f(x,y)-z1)/(z2-z1))

s2 = plot3d(f(x,y), (x,-2,2), (y,-2,2), color=(col,colormaps.coolwarm), plot_points=80)
p2 = project_xy_xz_yz(s2,[-1,3,3])
show(s2+sum(p2), aspect_ratio=[1,1,2], frame=False)
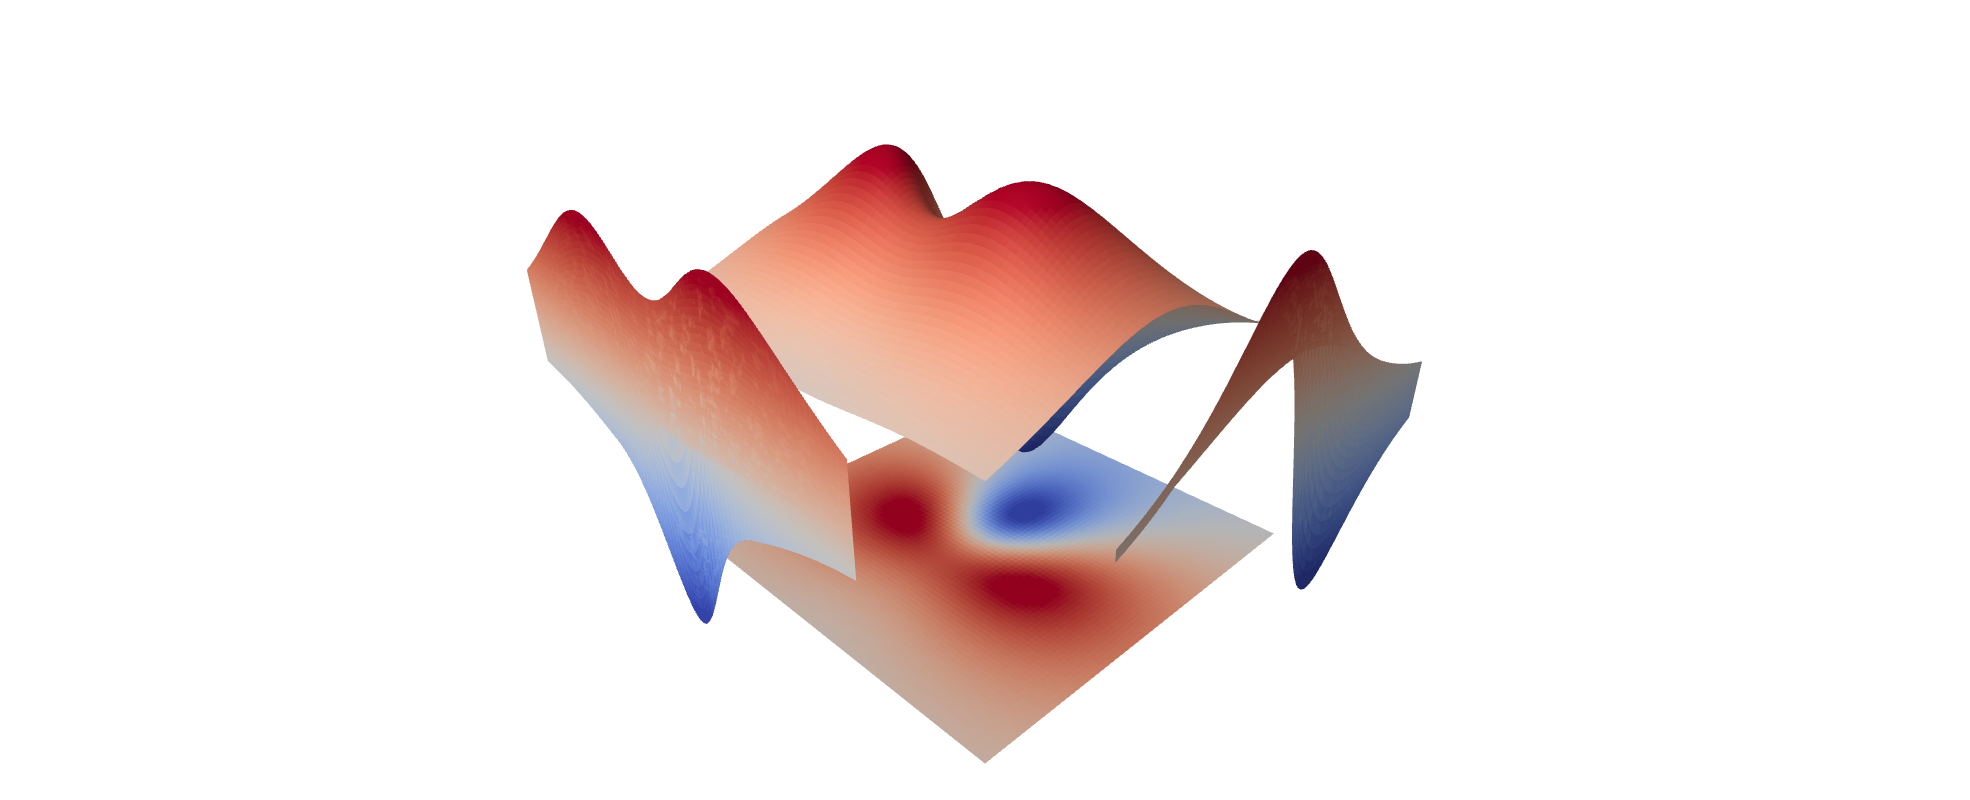
I think that the function extrema are easily seen in the projections.
You can play this examples in this SageMath cell.

