color parametric_plot3d - bug?

Failing:
 var("x,y,z,t")

f(x,y,z)=y-x+2*z^2

fMax=2.3; fMin=-0.3
def col(x,y,z):
    return (f(x,y,z)-fMin)/(fMax-fMin)


C_1(t)=(1/2*cos(t), 1/2*sin(t) + 1/2, sqrt(-1/4*(sin(t) + 1)^2 - 1/4*cos(t)^2 + 1))

plot_C_1=parametric_plot3d(C_1(t), (t, 0, 2*pi), color = (col(*C_1(t)), colormaps.jet))

show(plot_C_1)

---------------------------------------------------------------------------
TypeError                                 Traceback (most recent call last)
/opt/sagemath-9.0/local/lib/python3.7/site-packages/sage/symbolic/expression.pyx in sage.symbolic.expression.Expression.__float__ (build/cythonized/sage/symbolic/expression.cpp:10936)()
   1432         try:
-> 1433             ret = float(self._eval_self(float))
   1434         except TypeError:

/opt/sagemath-9.0/local/lib/python3.7/site-packages/sage/symbolic/expression.pyx in sage.symbolic.expression.Expression._eval_self (build/cythonized/sage/symbolic/expression.cpp:10067)()
   1240         else:
-> 1241             raise TypeError("Cannot evaluate symbolic expression to a numeric value.")
   1242

TypeError: Cannot evaluate symbolic expression to a numeric value.

During handling of the above exception, another exception occurred:

TypeError                                 Traceback (most recent call last)
/opt/sagemath-9.0/local/lib/python3.7/site-packages/sage/symbolic/expression.pyx in sage.symbolic.expression.Expression.__float__ (build/cythonized/sage/symbolic/expression.cpp:10998)()
   1435             try:
-> 1436                 c = (self._eval_self(complex))
   1437                 if imag(c) == 0:

/opt/sagemath-9.0/local/lib/python3.7/site-packages/sage/symbolic/expression.pyx in sage.symbolic.expression.Expression._eval_self (build/cythonized/sage/symbolic/expression.cpp:10067)()
   1240         else:
-> 1241             raise TypeError("Cannot evaluate symbolic expression to a numeric value.")
   1242

TypeError: Cannot evaluate symbolic expression to a numeric value.

During handling of the above exception, another exception occurred:

TypeError                                 Traceback (most recent call last)
<ipython-input-77-c93f611fa629> in <module>()
     10 __tmp__=var("t"); C_1 = symbolic_expression((Integer(1)/Integer(2)*cos(t), Integer(1)/Integer(2)*sin(t) + Integer(1)/Integer(2), sqrt(-Integer(1)/Integer(4)*(sin(t) + Integer(1))**Integer(2) - Integer(1)/Integer(4)*cos(t)**Integer(2) + Integer(1)))).function(t)
     11
---> 12 plot_C_1=parametric_plot3d(C_1(t), (t, Integer(0), Integer(2)*pi), color = (col(*C_1(t)), colormaps.jet))
     13
     14 show(plot_C_1)

/opt/sagemath-9.0/local/lib/python3.7/site-packages/sage/misc/decorators.py in wrapper(*args, **kwds)
    651                     kwds[new_name] = kwds[old_name]
    652                     del kwds[old_name]
--> 653             return func(*args, **kwds)
    654
    655         return wrapper

/opt/sagemath-9.0/local/lib/python3.7/site-packages/sage/plot/plot3d/parametric_plot3d.py in parametric_plot3d(f, urange, vrange, plot_points, boundary_style, **kwds)
   1005         if plot_points == "automatic":
   1006             plot_points = 75
-> 1007         G = _parametric_plot3d_curve(f, urange, plot_points=plot_points, **kwds)
   1008     else:
   1009         if plot_points == "automatic":

/opt/sagemath-9.0/local/lib/python3.7/site-packages/sage/plot/plot3d/parametric_plot3d.py in _parametric_plot3d_curve(f, urange, plot_points, **kwds)
   1065     f_x, f_y, f_z = g
   1066     w = [(f_x(u), f_y(u), f_z(u)) for u in xsrange(*ranges[0], include_endpoint=True)]
-> 1067     return line3d(w, **kwds)
   1068
   1069

/opt/sagemath-9.0/local/lib/python3.7/site-packages/sage/misc/decorators.py in wrapper(*args, **kwds)
    651                     kwds[new_name] = kwds[old_name]
    652                     del kwds[old_name]
--> 653             return func(*args, **kwds)
    654
    655         return wrapper

/opt/sagemath-9.0/local/lib/python3.7/site-packages/sage/plot/plot3d/shapes2.py in line3d(points, thickness, radius, arrow_head, **kwds)
    144         points[i] = float(x), float(y), float(z)
    145     if radius is None:
--> 146         L = Line(points, thickness=thickness, arrow_head=arrow_head, **kwds)
    147         L._set_extra_kwds(kwds)
    148         L._extra_kwds['thickness'] = thickness  # remove this line if json_repr is defined

/opt/sagemath-9.0/local/lib/python3.7/site-packages/sage/plot/plot3d/shapes2.py in __init__(self, points, thickness, corner_cutoff, arrow_head, **kwds)
    882         if len(points) < 2:
    883             raise ValueError("there must be at least 2 points")
--> 884         PrimitiveObject.__init__(self, **kwds)
    885         self.points = points
    886         self.thickness = thickness

/opt/sagemath-9.0/local/lib/python3.7/site-packages/sage/plot/plot3d/base.pyx in sage.plot.plot3d.base.PrimitiveObject.__init__ (build/cythonized/sage/plot/plot3d/base.c:34083)()
   2501                 self.texture = Texture(self.texture)
   2502         else:
-> 2503             self.texture = Texture(kwds)
   2504
   2505     def set_texture(self, texture=None, **kwds):

/opt/sagemath-9.0/local/lib/python3.7/site-packages/sage/plot/plot3d/texture.py in Texture(id, **kwds)
    186     if id is None:
    187         id = _new_global_texture_id()
--> 188     return Texture_class(id, **kwds)
    189
    190

/opt/sagemath-9.0/local/lib/python3.7/site-packages/sage/plot/plot3d/texture.py in __init__(self, id, color, opacity, ambient, diffuse, specular, shininess, name, **kwds)
    310                 opacity = color[3]
    311             color = tuple(float(1) if c == 1 else float(c) % 1
--> 312                           for c in color[0: 3])
    313
    314         self.color = color

/opt/sagemath-9.0/local/lib/python3.7/site-packages/sage/plot/plot3d/texture.py in <genexpr>(.0)
    310                 opacity = color[3]
    311             color = tuple(float(1) if c == 1 else float(c) % 1
--> 312                           for c in color[0: 3])
    313
    314         self.color = color

/opt/sagemath-9.0/local/lib/python3.7/site-packages/sage/symbolic/expression.pyx in sage.symbolic.expression.Expression.__float__ (build/cythonized/sage/symbolic/expression.cpp:11129)()
   1440                     raise
   1441             except TypeError:
-> 1442                 raise TypeError("unable to simplify to float approximation")
   1443         return ret
   1444

TypeError: unable to simplify to float approximation

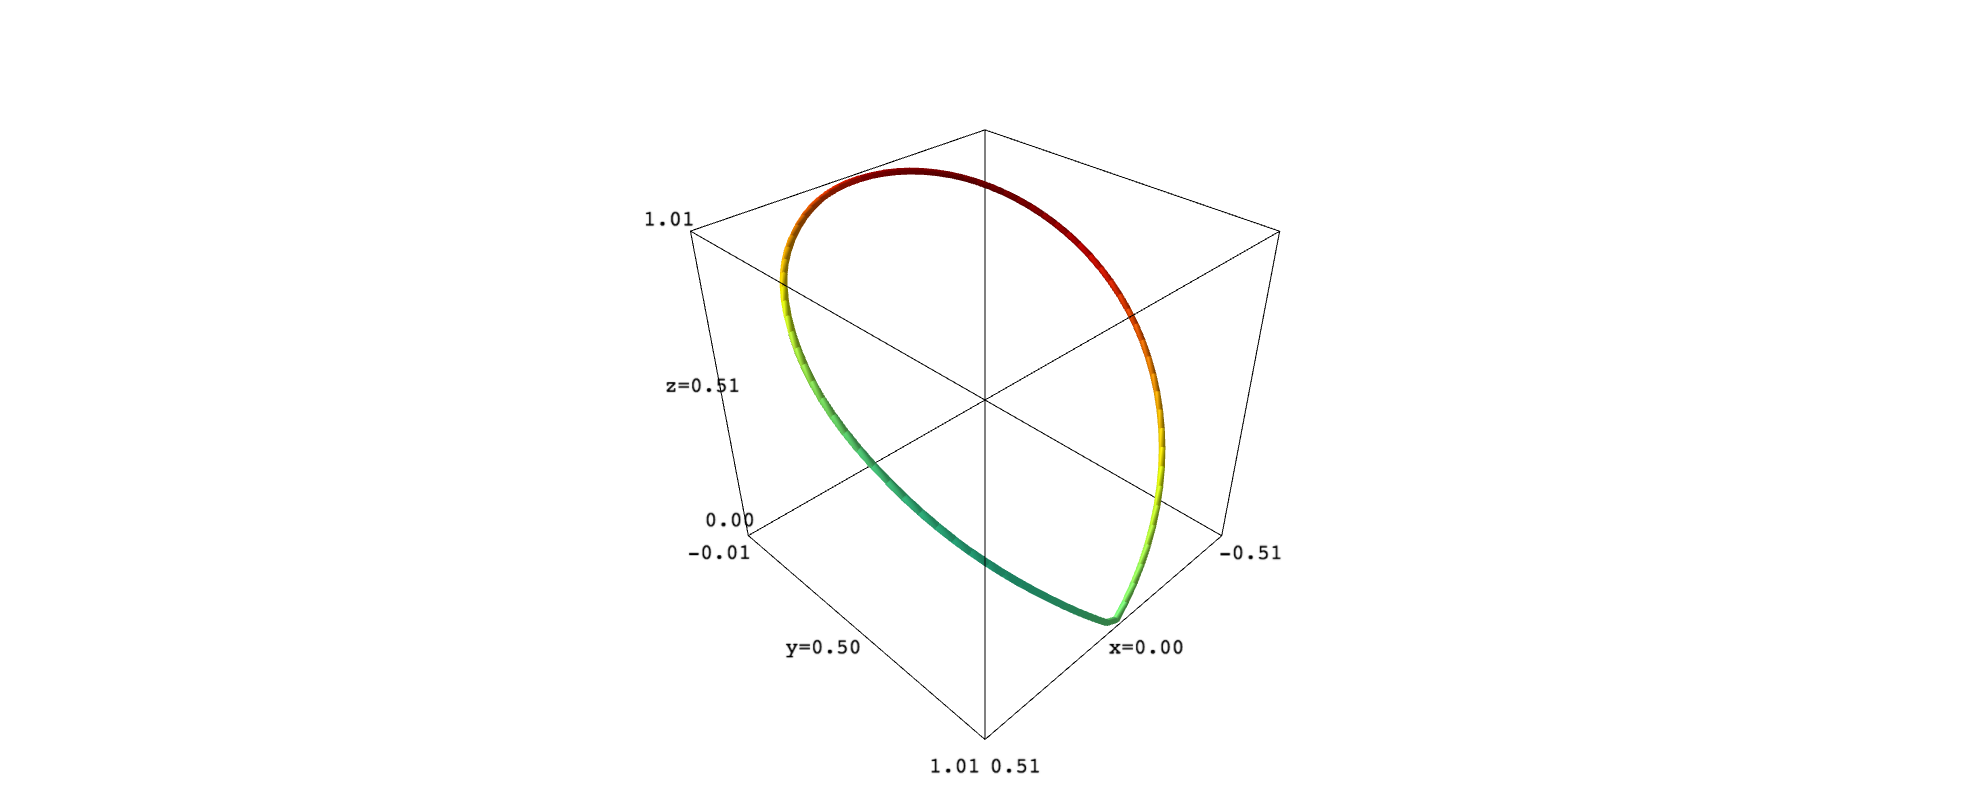

This kind of color syntax using (function, colormap) is not available for 1-dimensional curves, only for surfaces.