Centering the graphics output
Is there a way to ask Sagemath to center the graphics in the page ?
Is there a way to ask Sagemath to center the graphics in the page ?
Hi Cyrille
What OS and What Sagemath notebook ?
for me with Ubuntu 18.04 and Sagemath notebook 9.0 it is working with putting:
.output_png {
    display: table-cell;
    text-align: center;
    margin:auto;
}
.prompt
    display:none;
}
at the end in my css file:./local/lib/python3.7/site-packages/notebook/static/custom/custom.css
like it is recommended in the link above.

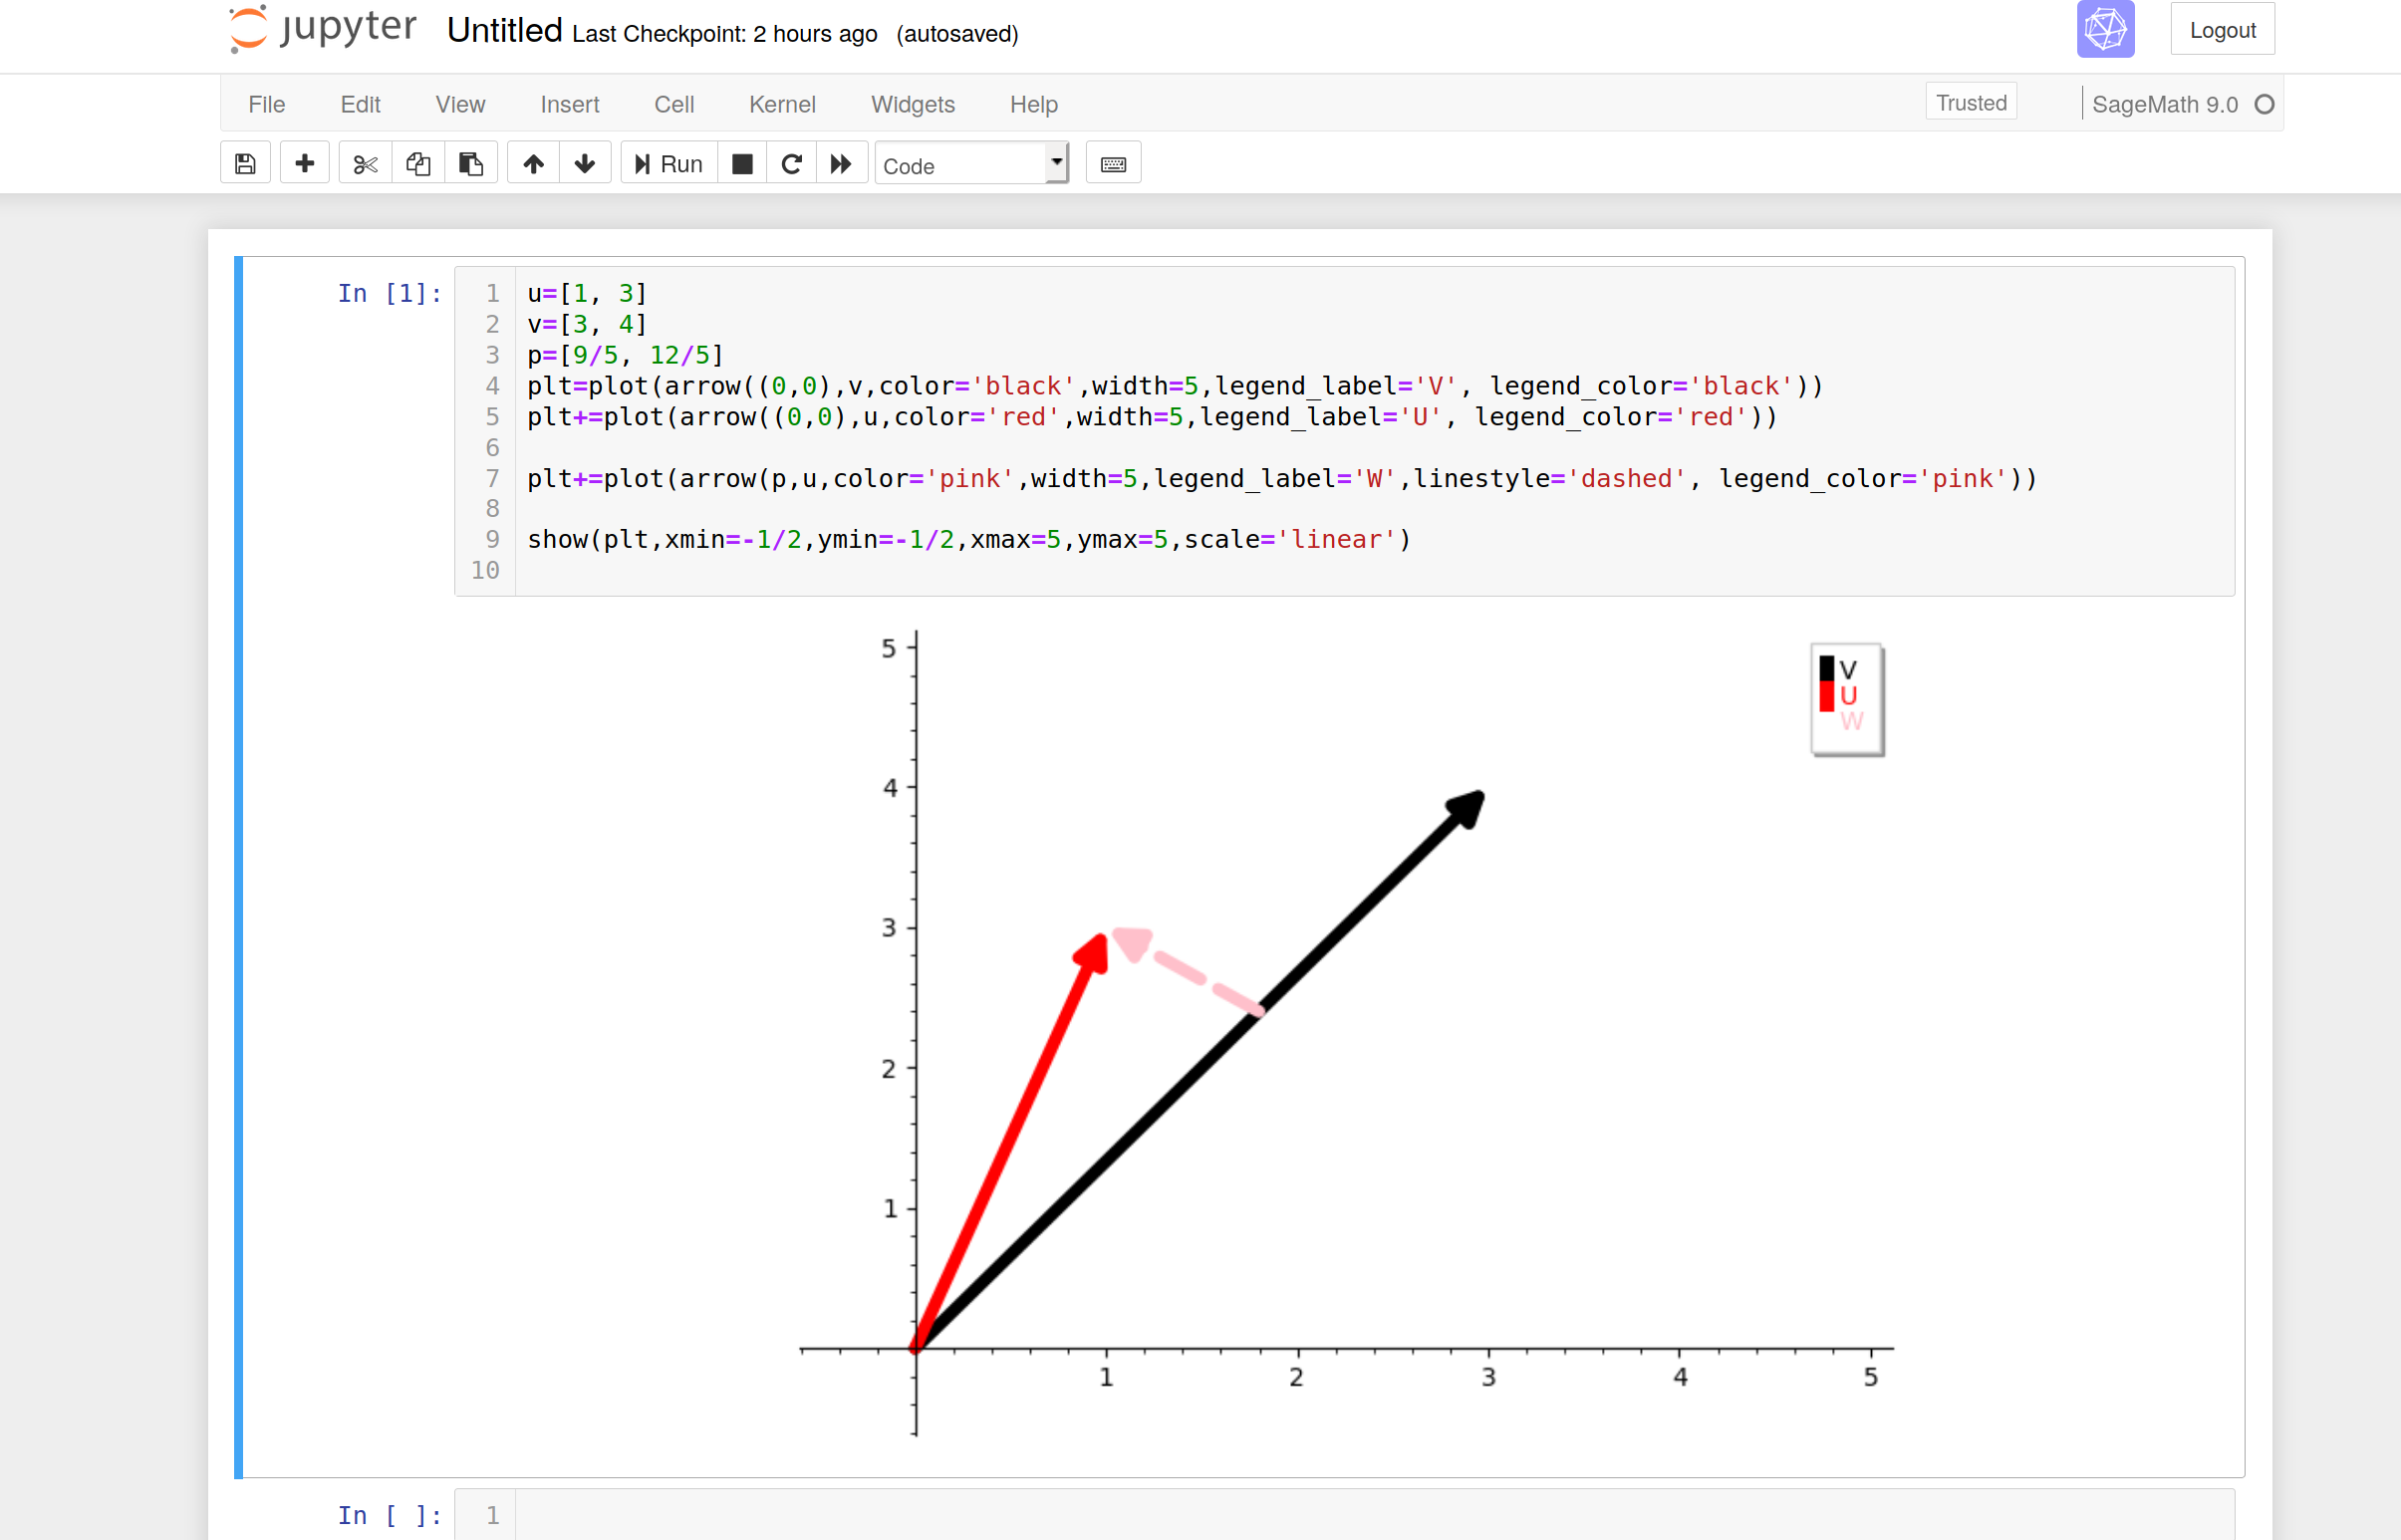
I also have a question that I allow myself to add in comment in your question(because it is in relation): how to do so that in the code following the x-axis scale is the same as the y-axis? (so that the angle between the pink vector and the black vector appears at right angles)
u=[1, 3]
v=[3, 4]
p=[9/5, 12/5]
plt=plot(arrow((0,0),v,color='black',width=5,legend_label='V', legend_color='black'))
plt+=plot(arrow((0,0),u,color='red',width=5,legend_label='U', legend_color='red'))

plt+=plot(arrow(p,u,color='pink',width=5,legend_label='W',linestyle='dashed', legend_color='pink'))

show(plt,xmin=-1/2,ymin=-1/2,xmax=5,ymax=5,scale='linear')
Please start posting anonymously - your entry will be published after you log in or create a new account.
Asked: 2020-04-22 08:41:04 +0200
Seen: 485 times
Last updated: Apr 22 '20
 Copyright Sage, 2010. Some rights reserved under creative commons license. Content on this site is licensed under a Creative Commons Attribution Share Alike 3.0 license.