How to plot the Binomial Distribution
Hey there, is there a macro for
?
add a comment
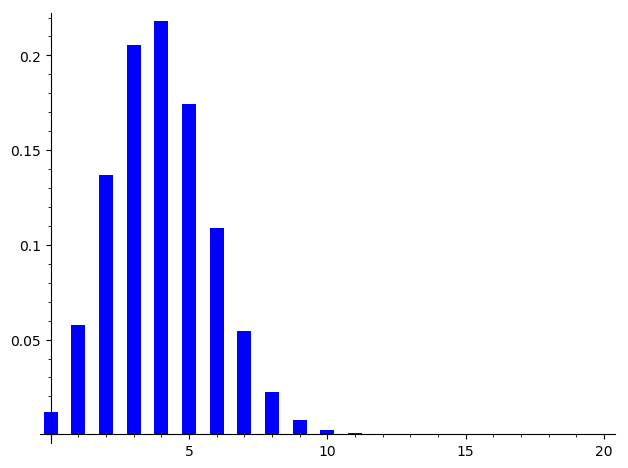
The formula can be written in SageMath using binomial, but you may also use binom from the scipy library:
sage: import scipy.stats
sage: binom_dist = scipy.stats.binom(20,.20)
sage: bar_chart([binom_dist.pmf(k) for k in range(20)])
See the Sage quick start for statistics page. As explained in the doc of
sage: scipy.stats.binom?
pmf stands for Probability mass function.
Asked: 2020-04-05 19:47:23 +0200
Seen: 2,025 times
Last updated: Apr 06 '20
 Copyright Sage, 2010. Some rights reserved under creative commons license. Content on this site is licensed under a Creative Commons Attribution Share Alike 3.0 license.