Ask Your Question
1

Enhanced table

asked 2020-04-04 19:24:22 +0200

Cyrille gravatar image

updated 2020-04-10 20:17:27 +0200

slelievre gravatar image

This code creates a nice table

sage: rows = [[100, 2, 3], [4, 5, 60]]
sage: t = table(rows, header_row=['a', 'b', 'c'], header_column=['', 'aa', 'bb'])
sage: show(t)

but aa and bb are not in bold. How to obtain a bold face and some separators between lines and columns?

edit retag flag offensive close merge delete

2 Answers

Sort by ยป oldest newest most voted
4

answered 2020-04-04 22:29:11 +0200

dsejas gravatar image

Hello, @Cyrille!

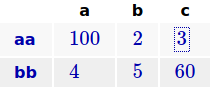
Am I correct to assume you want this in SageCell output? If that is the case, you can obtain bold fonts specifying manually that option: instead of 'a' in header_column, you can write r'<b>aa</b>'. The "r" just before the first simple quote sign indicates that this is a "raw string", so it must be used AS IS written by you; in this case, we are using a little bit of HTML, using the <b> and </b> to indicate bold font. So, you have to do:

rows = [[100,2,3], [4,5,60]]
t = table(rows, header_row=['a', 'b','c'], header_column=['',r'<b>aa</b>', r'<b>bb</b>'])
show(t)

image description

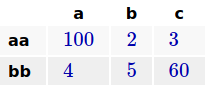
Now, I don't think this is exactly what you want. First of all, the aa and bb will appear to be blue. You can change that by using a little bit more of HTML:

rows = [[100,2,3], [4,5,60]]
t = table(rows, header_row=['a', 'b','c'], header_column=['',r'<b style="color:black">aa</b>', r'<b style="color:black">bb</b>'])
show(t)

image description

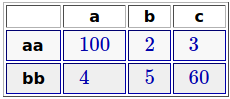
Finally, I understand that you want a frame for your table. You have to use the frame=True option:

rows = [[100,2,3], [4,5,60]]
t = table(rows, header_row=['a', 'b','c'], header_column=['',r'<b style="color:black">aa</b>', r'<b style="color:black">bb</b>'], frame=True)
show(t)

image description

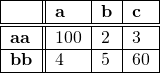
Of course, you can adapt this technique to other forms of output. For example, if you were working on Sage through LaTeX (by means of SageTeX, for example), you could do the following, which is equivalent to what we just did:

rows = [[100,2,3], [4,5,60]]
t = table(rows, header_row=[r'\textbf{a}','\textbf{b}','\textbf{c}'], header_column=['',r'\textbf{aa}', r'\textbf{bb}'], frame=True)
show(t)

However, do be careful, since the frame=True option already highlights the headers for the rows and columns by placing a double line separation, so perhaps using bold font is too much.

image description

One more thing: If you don't like the alignment of the columns, remember you can always use the align='center' option.

edit flag offensive delete link more

Comments

Thanks Nice answer

Cyrille gravatar imageCyrille ( 2020-04-05 03:57:18 +0200 )edit

I have just a little comment. On my computer frame=True doesn't works

Cyrille gravatar imageCyrille ( 2020-04-06 12:54:14 +0200 )edit

Hello, @Cyrille! It seems that frame=True doesn't work properly on Jupyter notebooks. I tested my code in the Sage terminal, SageCell and CoCalc, and it seems to work properly there, although the results are a little different in each environment.

I have posted this related question, so we can find a solution.

dsejas gravatar imagedsejas ( 2020-04-06 17:35:18 +0200 )edit

Hello, @Cyrille! There seems to be a problem (outdated code) in the table() command code. You can see the question I mentioned in my previous comment. There, you can also see @Juanjo's answer, which will help you to make tables as you expected to. Basically, in Jupyter, you have to put that code in one cell, press CTRL+ENTER, and then create your table in any cell following that one.

Although this is a temporary solution, you can also use that answer to further customize tables in Jupyter. I will try to send a patch to the Sage source code to improve tables a little bit, including this frame=True argument.

dsejas gravatar imagedsejas ( 2020-04-07 02:16:57 +0200 )edit

@dsejas. In fact, the cell of the form

%%html
<style>
...
</style>

given in the other question can be placed everywhere in the notebook. The important thing is to not delete its output or reevaluate this cell if output is globally cleared (for example, after choosing Kernel>Restart&Clear Output). This is the way I customize the layout of my notebooks.

Juanjo gravatar imageJuanjo ( 2020-04-07 03:29:35 +0200 )edit
1

answered 2020-04-10 21:34:38 +0200

slelievre gravatar image

One way to obtain tables that display nicely is to use the Pandas package.

import pandas as pd
pd.DataFrame(data={'a': [100, 4], 'b': [2, 5], 'c': [3, 60]}, index=['aa', 'bb'])

To use it in Sage, you first need to install it.

This can be done by running this in the terminal:

sage --pip install pandas
edit flag offensive delete link more

Your Answer

Please start posting anonymously - your entry will be published after you log in or create a new account.

Add Answer

Question Tools

1 follower

Stats

Asked: 2020-04-04 19:24:22 +0200

Seen: 837 times

Last updated: Apr 10 '20