Ask Your Question
2

Fill intersection of multiple ellipses

asked 2020-02-22 19:11:41 +0200

mattb gravatar image

I'm plotting multiple ellipses via the ellipse() function. I want to only fill the area where they all overlap. I see there are many options for plotting and filling. However, all the examples I've seen refer to other types of plots that would not be compatible with ellipses. Is there a way to automatically fill the overlapping area of multiple ellipses without pre-calculating this area?

For example, two of the ellipse functions would be:

4.31814496201205*x^2 + 0.442360403122904*x*y + 0.0424448964961035*y^2 - 0.170411375833593*x - 0.0205526646997484*y - 2.4358560850288997
ellipse((0.01, 0.19), 8.86, 0.75, 92.96*pi/180)

7.81630506700337*x^2 - 47.0795923749769*x*y + 72.3295112191380*y^2 + 8.78879644990554*x - 27.0144183395227*y + 0.1289109700897777
ellipse((0.01, 0.19), 4.13, 0.17, 18.06*pi/180)
edit retag flag offensive close merge delete

2 Answers

Sort by ยป oldest newest most voted
3

answered 2020-02-23 03:27:35 +0200

Juanjo gravatar image

updated 2020-02-23 11:15:19 +0200

Suppose that there are $k$ ellipses and let $R_i$ be the bounded region limited by the $i$th-ellipse. Assume that $R_i$ is given by the relation $E_i(x,y)\leq0$. Consider the function $$S(x,y) = \sum_{i=1}^k \mathrm{sgn}(E_i(x,y)).$$ For $j=0,\ldots,k$, a point lying in the intersection of $j$ regions $R_i$ satisfies that $$S(x,y)=-j + (k-j)=k-2j.$$ So, one has to plot the contours of $S$ for the values $-k,-k+2,-k+4,\ldots,k$ to get the points lying in all regions $R_i$, in all but one regions, in all but two regions,..., in no region $R_i$, respectively. For example, consider the following code:

E1 = 3*x^2+5*x*y+8*y^2-2*x-30
E2 = x^2-5*x*y+7*y^2+x-3*y-2
E3 = 20*x^2+2*x*y+7*y^2+x-3*y-65
E4 = 6*x^2-5*x*y+28*y^2-2*x+3*y-70
fun = sum(sgn(EE) for EE in [E1,E2,E3,E4])
contour_plot(fun, (x,-5,5), (y,-5,5),contours=[-4,-2,0,2,4],
             plot_points=300, fill=True, cmap="Spectral", colorbar=True)

It yields this image:

image description

Blue points lie in no region bounded by an ellipse; green points lie in only one region; brown points lie in two regions; red points, in three regions; dark red points are the intersection of all regions $R_i$.

EDIT. In fact, a better and general approach is to plot the function $$S=\sum_{i=1}^k \mathbf{1}_{R_i},$$ where $\mathbf{1}_{R_i}$ stands for the characteristic function of $R_i$. The interesting contours are now $0,1,2,\ldots,k$.

For the above case, it is clear that $$\mathbf{1}_{R_i}(x,y)=\mathrm{unit\_step}(-E_i(x,y)).$$ Hence, with the same ellipses, the code

fun = sum(unit_step(-EE) for EE in [E1,E2,E3,E4])
contour_plot(fun, (x,-5,5), (y,-5,5), contours=[0..4],
             plot_points=300, fill=True, cmap="Spectral_r", colorbar=True)

yields this figure:

image description

The color bar now directly says the number of regions to which a point belongs.

edit flag offensive delete link more

Comments

Thank you! This is a great answer. This is exactly what I was trying to do.

mattb gravatar imagemattb ( 2020-02-25 13:27:14 +0200 )edit
0

answered 2020-02-22 22:22:54 +0200

Emmanuel Charpentier gravatar image

updated 2020-02-23 00:31:27 +0200

EDIT : The solution below is valid only for the special case presented here, not generally... I keep it here temporarily, but now think that there may not be a general solution.

Your question isn't as trivial as I thought initially. But your restriction:

without pre-calculating this area

points to a (semi-)trivial solution.

This restriction implies that you have at least a rough idea of the area where your intersectin might lie.

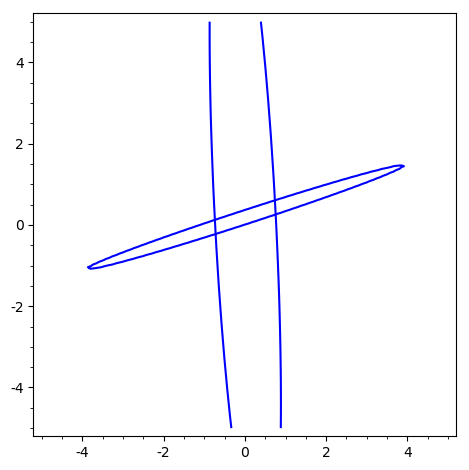
This rough idea might be obtained from a preliminary sketch. In your case:
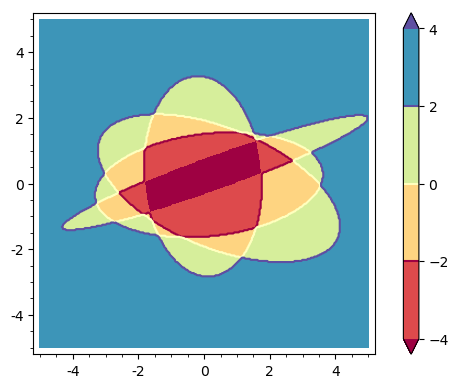
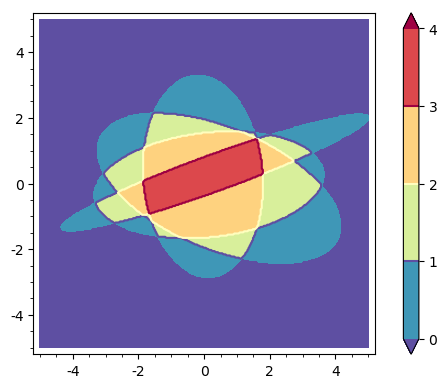
sage: var("x,y")
(x, y)
sage: E1(x,y)=4.31814496201205*x^2 + 0.442360403122904*x*y + 0.0424448964961035*y
....: ^2 - 0.170411375833593*x - 0.0205526646997484*y - 2.4358560850288997
sage: E2(x,y)=7.81630506700337*x^2 - 47.0795923749769*x*y + 72.3295112191380*y^2 
....: + 8.78879644990554*x - 27.0144183395227*y + 0.1289109700897777
sage: implicit_plot(E1,(-5,5),(-5,5))+implicit_plot(E2,(-5,5),(-5,5))

Superset of the intersection

It can also be obtained analytically : the intersection of n ellipses is necessarily a subset of the intersection of the two first ellipses. The coordinates of the intersections can be obtained analytically:

sage: S=solve([E1(x,y),E2(x,y)],[x,y],solution_dict=True)
sage: S
[{x: 0.7393521295740851, y: 0.606115403583758},
 {x: -0.7193521935219352, y: -0.2261153935996263},
 {x: -0.7381518244093387, y: 0.1250916710319539},
 {x: 0.7581518151815182, y: 0.254908323868246}]
sage: xmin=min([s.get(x) for s in S])
sage: xmax=max([s.get(x) for s in S])
sage: ymin=min([s.get(y) for s in S])
sage: ymax=max([s.get(y) for s in S])

Since all the coordinates are real, this intersection exists and isn't empty.region_plot can now be used to plot the intersectin of your ellipses (if it is not empty.

sage: region_plot(lambda x,y:E1(x,y)<0 and E2(x,y)<0, (xmin, xmax), (ymin, ymax),
....:  plot_points=200)

Intersection

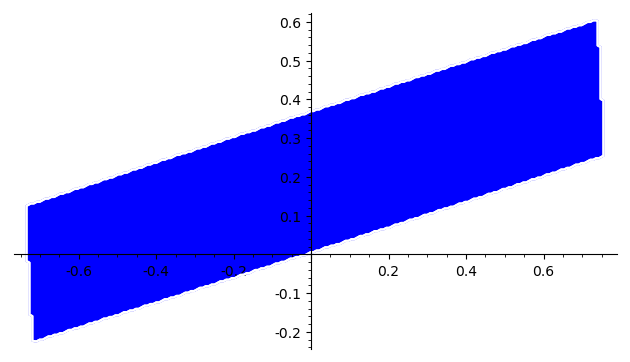
(One notes that, notwithstanding the plot_points=200 option, the sketch is relatively rough, and that its execution is slow. region_plot is a "brute-force" function...).

Of course, this solution is not really safisfactory: it will show you something ig the intersection of your n elipses is not empty, but this oinersection can be ridiculously small (i. e. invisible) if the intersection of your first two ellipses is small.

It is then probably better to compute the intersection of your ellipses before plotting it. This is not a trivial problem. ISTR that the geometry functions of Sgemath have a large section dedicated to polyhedra, a subject I know almost nothing about...

EDIT : vdelecroix comment is perfectly right : the proposed solution is but an approximation. And suffers counterexamples (think of an ellipse totally included in another : the edges have no intersection, and the intersection of the diks is the interior ellipse...).

HTH,

edit flag offensive delete link more

Comments

1

Even though ellipses are convex, they are not polyhedra!

vdelecroix gravatar imagevdelecroix ( 2020-02-22 23:36:13 +0200 )edit

Thanks for the idea. Actually, this was kind of how I was trying to tackle the problem. Your answer got further than I was able to. But the contour plot approach shown by Juanjo seems to work well, and give me the end result I was looking for.

mattb gravatar imagemattb ( 2020-02-25 13:29:24 +0200 )edit

Your Answer

Please start posting anonymously - your entry will be published after you log in or create a new account.

Add Answer

Question Tools

1 follower

Stats

Asked: 2020-02-22 19:11:41 +0200

Seen: 423 times

Last updated: Feb 23 '20