Ask Your Question
2

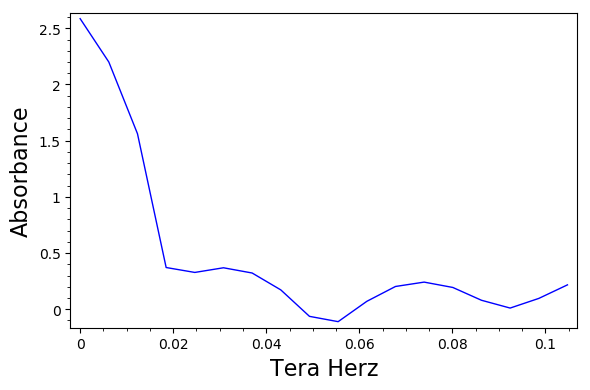
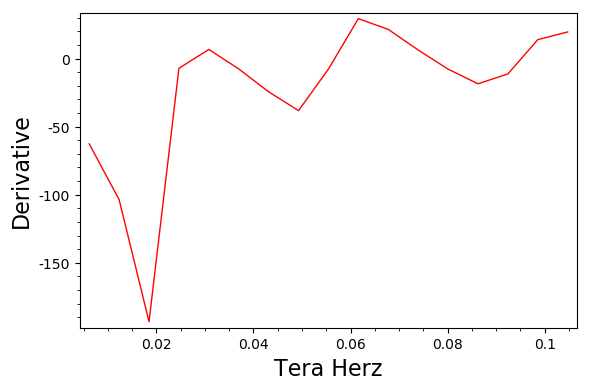
Derivative of a CSV data set

asked 2019-06-09 18:18:23 +0200

EnlightenedFunk gravatar image

updated 2019-06-10 15:45:40 +0200

I am trying to get the derivative of this CSV data set, and this is code I have so far I thought it would be similar to this matlab code:

dy=diff(y)./diff(x)
plot(x(2:end),dy)

Data Set:

0,2.58612
0.00616025,2.20018
0.0123205,1.56186
0.0184807,0.371172
0.024641,0.327379
0.0308012,0.368863
0.0369615,0.322228
0.0431217,0.171899
0.049282,-0.0635003
0.0554422,-0.110747
0.0616025,0.0701394
0.0677627,0.202381
0.073923,0.241264
0.0800832,0.193697
0.0862434,0.0797016
0.0924037,0.0103144
0.0985639,0.096153
0.104724,0.216782

There's more data...a lot more This is my attempt at the code:

import csv
data = list( csv.reader(open('C:/images/TEST1.txt','rU')) )
data = map(lambda x: [float(x[0]),float(x[1])],data)
P = list_plot(data, plotjoined= True, color = 'blue', xmin = 0, xmax = 3)
TeraHertz = text('Tera Hertz', (1.5,-.9)) 
Absorbance = text('Absorbance', (0.8,5))
g = P + TeraHertz + Absorbance
g.show()
latex(g)
g.save('TeraHertzTEST1.pgf')
t=diff(x[1]).diff(x[0])
l = plot(x[0],t)
l.show()
edit retag flag offensive close merge delete

Comments

If possible, please post a link to the csv data set. It might help come up with answers to the question.

slelievre gravatar imageslelievre ( 2019-06-10 11:21:11 +0200 )edit

@slelievre Ok I will, it keeps saying greater thaan 60 points to upload file....

EnlightenedFunk gravatar imageEnlightenedFunk ( 2019-06-10 15:37:32 +0200 )edit

@slelievre I entered as many data points there is just a lot more data.

EnlightenedFunk gravatar imageEnlightenedFunk ( 2019-06-11 17:32:19 +0200 )edit
1

What actually is the problem? Why didn't this work? If the data is very large you might also consider using numpy to load the data set: import numpy as np; data = np.loadtxt('data.txt', delimiter=','). See loadtxt for more. For large data sets using Numpy will be both much faster than manually parsing strings returned by the standard Python csv module, and will be much, much more memory-efficient. Honestly, the SageMath documentation does not do enough to emphasize use of Numpy.

Iguananaut gravatar imageIguananaut ( 2019-06-12 12:20:19 +0200 )edit

I think that the problem was the lack of a pure Python equivalent of the Matlab diff function, which can be replaced with a list comprehension. Anyway, you are right, things are more easily and efficiently done with Numpy.

Juanjo gravatar imageJuanjo ( 2019-06-12 13:06:47 +0200 )edit

1 Answer

Sort by ยป oldest newest most voted
4

answered 2019-06-12 03:42:44 +0200

Juanjo gravatar image

updated 2019-06-12 12:58:55 +0200

Please, try the following code:

import csv
with open("test.csv") as csv_file:
    data = list(csv.reader(csv_file))
ndata = len(data)
data = map(lambda x: [float(x[0]),float(x[1])], data)
data = matrix(data)
P = list_plot(data, plotjoined=True, color="blue",
              frame=True, axes=False, axes_labels=["Tera Herz", "Absorbance"])
P.show()
t = [(data[i+1,1]-data[i,1])/(data[i+1,0]-data[i,0]) for i in range(ndata-1)]
l = list_plot(zip(data[1:,0].list(),t), plotjoined=True, color='red',
              frame=True, axes=False, axes_labels=["Tera Herz", "Derivative"])
l.show()

Here, test.csv is a file with the data you provided. As an alternative, with a more clear code but perhaps slower:

import csv
with open("test.csv") as csv_file:
    data = csv.reader(csv_file)
    xx, yy = [], []
    for row in data:
        xx.append(float(row[0]))
        yy.append(float(row[1]))
ndata = len(xx)
P = list_plot(zip(xx,yy), plotjoined=True, color="blue",
              frame=True, axes=False, axes_labels=["Tera Herz", "Absorbance"])
P.show()
t = [(yy[i+1]-yy[i])/(xx[i+1]-xx[i]) for i in range(ndata-1)]
l = list_plot(zip(xx[1:],t), plotjoined=True, color="red",
              frame=True, axes=False, axes_labels=["Tera Herz", "Derivative"])
l.show()

Edited. Following the advice of @Iguananaut, let us use Numpy. The code becomes:

import numpy as np
data = np.loadtxt("test.csv", delimiter=",")
P = list_plot(data, plotjoined=True, color="blue",
              frame=True, axes=False, axes_labels=["Tera Herz", "Absorbance"])
P.show()
t = np.diff(data[:,1])/np.diff(data[:,0])
l = list_plot(zip(data[1:,0],t), plotjoined=True, color='red',
              frame=True, axes=False, axes_labels=["Tera Herz", "Derivative"])
l.show()

In any case I get the following pictures: image description image description

edit flag offensive delete link more

Comments

1

For actually loading the csv data I would use Numpy and not these slow pure Python loops. See my comment above.

Iguananaut gravatar imageIguananaut ( 2019-06-12 12:21:19 +0200 )edit

Hello this might seem annoying but is there a way to export that derivative data into a CSV?

EnlightenedFunk gravatar imageEnlightenedFunk ( 2019-06-12 15:48:46 +0200 )edit
1

Yes, just add

np.savetxt("deriv.csv", zip(data[1:,0],t), delimiter=",")

at the end of the last block of code. See https://docs.scipy.org/doc/numpy/reference/generated/numpy.savetxt.html for details on savetext.

Juanjo gravatar imageJuanjo ( 2019-06-12 16:40:33 +0200 )edit

Your Answer

Please start posting anonymously - your entry will be published after you log in or create a new account.

Add Answer

Question Tools

1 follower

Stats

Asked: 2019-06-09 18:18:23 +0200

Seen: 920 times

Last updated: Jun 12 '19