Ask Your Question
2

Putting label in the right spot (upper-left) during animation

asked 2019-05-12 22:53:09 +0100

Algebear gravatar image

updated 2019-06-20 13:10:15 +0100

FrédéricC gravatar image

I'm quite new to SageMath. It took some time (half a sunday) to create a code the draws an elliptic curve with a cubic, controlling the speed of the animation and putting a label in. However, I don't know where I can put something like a legend_loc='upper left somewhere or whether that's even possible. My code is as follows:

step=0.2;
var('x,y');
a=animate([
plot(EllipticCurve(y^2==x^3+3.8*x^2-0.8*x+float(k)),xmin=-6,xmax=0
,color="red",thickness=2,legend_label=r'$y^2=x^3+3.8x^2-0.8x+{}$'.format(float(k))) 
+plot(EllipticCurve(y^2==x^3+3.8*x^2-0.8*x+float(k)),xmin=10^(-9),xmax=6
,color="red",thickness=2) 
+ plot(x^3+3.8*x^2-0.8*x+float(k),xmin=-6,xmax=6,color="blue",thickness=1)
for k in srange(-5,5,step)],xmin=-6,xmax=6,ymin=-20,ymax=20,gridlines=[[-6,6],[-20,20]]);
a.show(delay=1)

I also tried set_legend_options(shadow=False, loc=2) in the plot function, but that doesn't satisfy SageMath either. Anyone an idea how I can put that label at some fixed spot? Btw, it would be even better if I could put that label on the top centre above the animation. I appreciate any suggestions and help.

edit retag flag offensive close merge delete

2 Answers

Sort by » oldest newest most voted
2

answered 2019-05-13 21:50:50 +0100

rburing gravatar image

updated 2019-05-15 20:56:16 +0100

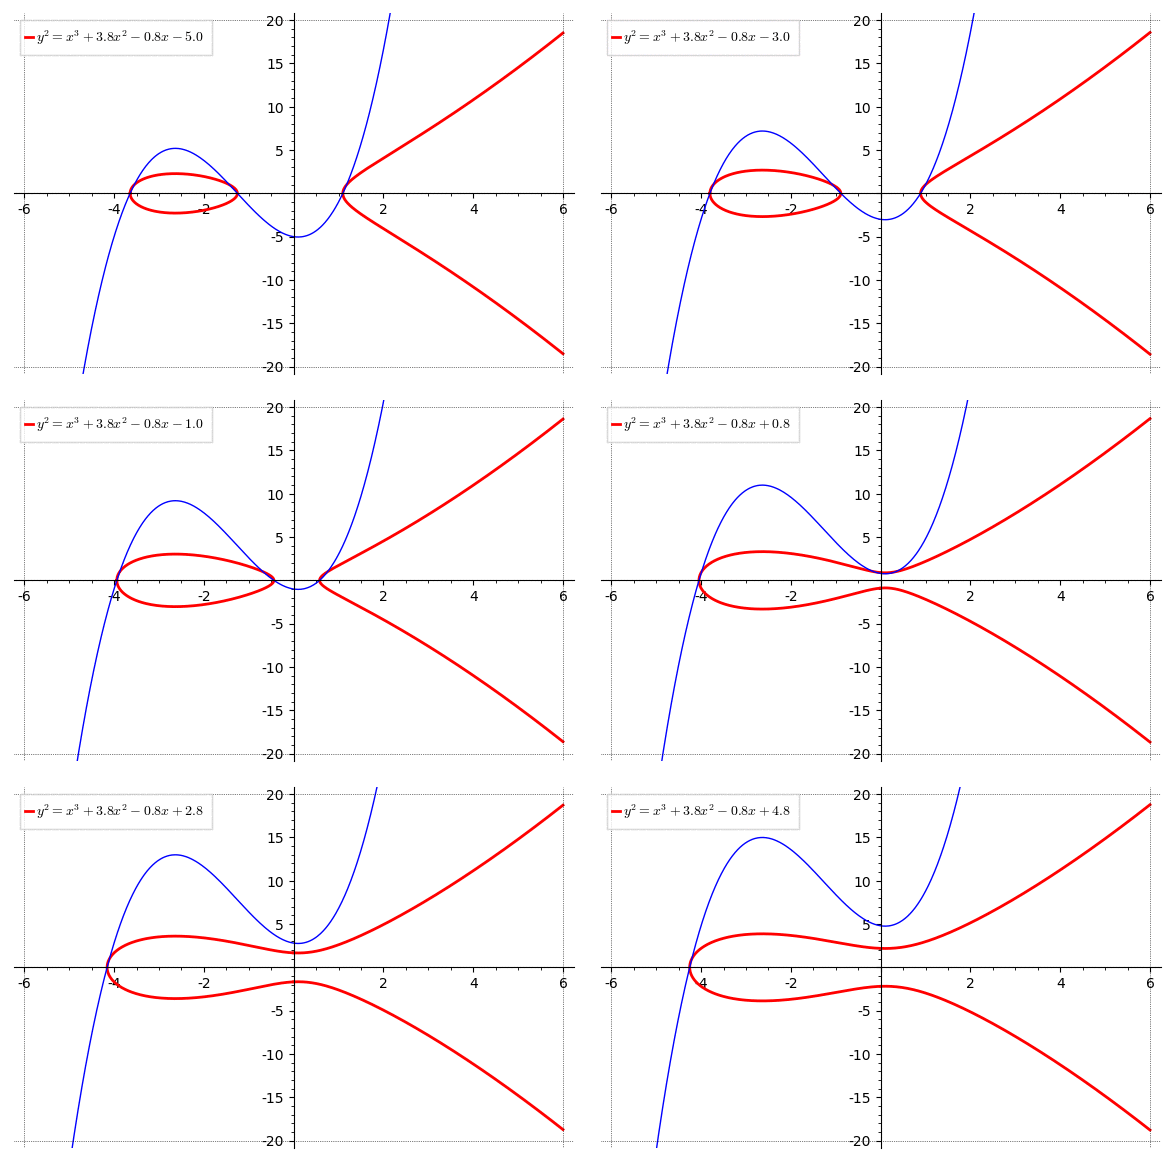
You have to call set_legend_options on the individual plots after they're created. For simplicity, define a helper function which creates the individual plots (so you can call set_legend_options there):

step=0.2;
var('x,y');
def my_plot(k):
    P = plot(EllipticCurve(y^2==x^3+3.8*x^2-0.8*x+float(k)),xmin=-6,xmax=0,color="red",thickness=2,legend_label=r'$y^2=x^3+3.8x^2-0.8x' + ('+' if k >=0 else '') + '{0:.1f}$'.format(float(k)))
    P += plot(EllipticCurve(y^2==x^3+3.8*x^2-0.8*x+float(k)),xmin=10^(-9),xmax=6,color="red",thickness=2)
    P += plot(x^3+3.8*x^2-0.8*x+float(k),xmin=-6,xmax=6,color="blue",thickness=1)
    P.set_legend_options(shadow=False, loc=2)
    return P
a=animate([my_plot(k) for k in srange(-5,5,step)],xmin=-6,xmax=6,ymin=-20,ymax=20,gridlines=[[-6,6],[-20,20]]);
a.show(delay=1)

image description

I also fixed the legend_label so the number is rounded and it shows + or - correctly.


Original (bad) answer:

Btw, it would be even better if I could put that label on the top centre above the animation.

To do this, use the title keyword instead of legend_label.

edit flag offensive delete link more

Comments

But then it is not a legend anymore :-/

Algebear gravatar imageAlgebear ( 2019-05-13 21:54:18 +0100 )edit

That's true, sorry :( Hopefully you will get a better answer.

rburing gravatar imagerburing ( 2019-05-13 22:19:47 +0100 )edit

Now my answer is a better answer.

rburing gravatar imagerburing ( 2019-05-15 20:57:03 +0100 )edit

This is even better indeed! I must say that I didn't even notice the plus- and minus sign changing at first. Nice solution!

Algebear gravatar imageAlgebear ( 2019-05-15 22:31:36 +0100 )edit
0

answered 2019-05-15 20:16:29 +0100

That is quite impressive for half a Sunday! I'd suggest to forget about the legend command and use text. Add the two lines

  • text(r'$y^2=x^3+3.8x^2-0.8x{0:+}$'.format(float(k)),(3,-18),fontsize='large', fontweight='bold', color='red')
  • text(r'$y=x^3+3.8x^2-0.8x{0:+}$'.format(float(k)),(-3,18),fontsize='large', fontweight='bold', color='blue')

right after the plot of the cubic, ie as separate Graphics objects. I've tried this, the coordinates (3,-18) and (-3,18) put it in a nice spot within your animation. And with the text color, you don't need a little colored line telling the viewer what the label refers to. BUT did you notice the 0:+ instead of your curly braces formatting { } ?? The 0:+ needs curly braces around it as well, I swear I typed them, can even see them in Preview, but they get eaten when it's displayed. Likewise, instead of bullet points, you want plus signs to add the text elements.

Inserting 0:+ displays k with a + if positive, - if negative (in your version, you get a plus AND a minus sign if k<0). For more details than you ever want to know, see help('FORMATTING') There is still a weird instability for k=0, I wonder if that's coming from the math - maybe choose a range for k which does not hit zero exactly?

edit flag offensive delete link more

Comments

Yes, text would have been an option, but it's just a hassle sometimes to find the right spot (coordinates) for where to put that text. The plus and minus sign problem is solved in the other answer; this was not even a problem I noticed at first. But the code does the job now pretty well.

Algebear gravatar imageAlgebear ( 2019-05-15 22:35:37 +0100 )edit

Your Answer

Please start posting anonymously - your entry will be published after you log in or create a new account.

Add Answer

Question Tools

1 follower

Stats

Asked: 2019-05-12 22:52:37 +0100

Seen: 727 times

Last updated: May 15 '19