Ask Your Question
4

Combine plots with built-in Maxima, trajectory in Sage available?

asked 2019-01-10 20:45:43 +0200

Thrash gravatar image

updated 2019-01-10 21:21:02 +0200

I want to combine the following plots as one output figure:

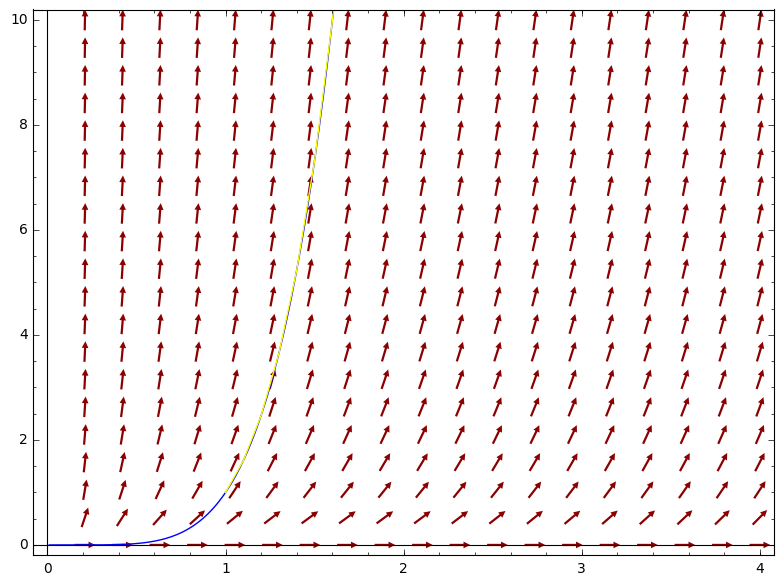
maxima('plotdf(4*y/x+x*sqrt(y),[trajectory_at,1,1],[x,0,4],[y,0,10])')
maxima('plot2d(1/4*x^4*(log(x)+2)^2,[x,0,4],[y,0,10])')

How can I achieve that? However, if there is any way to output a trajectory by Sage directly, I would be very happy. With pure Sage, I've just achieved this so far:

plot_slope_field(4*y/x+x*sqrt(y),(x,0,4),(y,0,10),headaxislength=3,headlength=3)
edit retag flag offensive close merge delete

4 Answers

Sort by ยป oldest newest most voted
2

answered 2019-01-12 17:52:38 +0200

danielvolinski gravatar image

You can combine plots in Maxima with the command "xfun" inside plotdf e.g.

plotdf([x+y,x/2+y], [xfun,"-0.7071*x;0.7071*x"])$

In you case:

plotdf(4*y/x+x*sqrt(y),[xfun,"x^4*(log(x)+2)^2/4"],
[trajectory_at,1,1],[x,0,4],[y,0,10])$

you can use several functions inside the quotes, separated by semi colons.

Daniel

edit flag offensive delete link more
0

answered 2019-01-12 14:06:52 +0200

Emmanuel Charpentier gravatar image

[ Not really an answer, but the damn server software refuses this as a comment... ]

I don't understand your beef with desolve's answer :

sage: y=function("y")(x)
sage: E1=diff(y(x),x)==4*y(x)/x+x*sqrt(y(x))
sage: S1=desolve(E1,y(x));S1
1/4*(2*_C + log(x))^2*x^4
sage: var("_C")
_C
sage: bool(E1.subs(y(x)==S1).subs(diff(y(x),x)==diff(S1,x)).canonicalize_radical())
True

Therefore, S1 is a set of solutions of E1 (though possibly not the set of solutions of S1, but this is another question).

BTW, both mathematica and sympy give the same answers (modulo presentation and constant's name) :

sage: mathematica("Factor[Part[DSolve[D[y[x],x]==4*y[x]/x+x*Sqrt[y[x]],y[x],x],1,1]]")
y[x] -> (x^4*(2*C[1] + Log[x])^2)/4
sage: import sympy
sage: sympy.dsolve(*[sympy.sympify(u) for u in [E1,y(x)]])_sage_()
y(x) == 1/4*(2*C1 + log(x))^2*x^4

algorithm="fricas" can't (currently) solve this ODE. Open question : quid of giac ?

edit flag offensive delete link more

Comments

Yes, the outputs are (seem to be) true for general solutions of this differential equation. But when it comes to initial values, at least (1,1), it gives a false output. Try this: y=function('y')(x);desolve(diff(y)==4*y/x+x*sqrt(y),y,ics=[1,1]).factor(). The output is 1/4*x^4*(log(x) - 2)^2 instead of 1/4*x^4*(log(x) + 2)^2. To get the two outputs in Mathematica, run this: DSolve[{D[y[x], x] == 4*y[x]/x + x*Sqrt[y[x]], y[1] == 1}, y[x], x].

Thrash gravatar imageThrash ( 2019-01-12 19:33:03 +0200 )edit

I see what you mean : your initial condition set admits both -1 and 1 as roots for _C, but your differenial equation E1 is verified only for _C=1. Mathematica gives you both solutions without warning, and Maxima picks the wrong one.

Film at 11...

BTW : sympy complains of NotImplementedError: Initial conditions produced too many solutions for constants, and throws the towel. giac seems to pick the right one.

Workaround :

  • Solve the (system of) differential equation(s), getting a solution with symbolic constants (usually not declared : declare them to Sage...)
  • Build a system composed of the ICS and the original differential equation(s).
  • Solve this system for the symbolic constants.
Emmanuel Charpentier gravatar imageEmmanuel Charpentier ( 2019-01-13 12:25:08 +0200 )edit

I consider this behavior a bug. Can you please open a ticket?

Thrash gravatar imageThrash ( 2019-01-14 04:39:24 +0200 )edit
2

answered 2019-01-11 15:13:13 +0200

rburing gravatar image

The Sage interface is the other way around; the numerical ODE solver desolve_rk4 can produce a plot:

var('x,y')
ode_rhs = 4*y/x+x*sqrt(y)
slope_field = plot_slope_field(ode_rhs, (x,0,4), (y,0,10), headaxislength=3, headlength=3, color='darkred')
exact_sol = plot(lambda x: 1/4*x^4*(log(x)+2)^2, xmin=0, xmax=4, ymin=0, ymax=10, color='blue')
integral_curve = desolve_rk4(ode_rhs, y, ivar=x, ics=[1,1], output='plot', xmax=4, ymax=10, color='yellow')
slope_field + exact_sol + integral_curve

image description

Indeed, the plots overlap.

edit flag offensive delete link more

Comments

Thank you very much! I didn't know about desolve_rk4. Due to the name I assume it's about a Runge-Kutta method. Great, the two curves overlap. I've noticed that desolve itself gives a wrong output. Try this: y=function('y')(x)desolve(diff(y)==4*y/x+x*sqrt(y),y,ics=[1,1]). It gives you a minus sign instead of a plus sign in 1/4*x^4*(log(x)+2)^2 (after factorizing the output). Mathematica outputs both. Should I open a new thread about this?

Thrash gravatar imageThrash ( 2019-01-11 16:16:23 +0200 )edit

Yes, you can find the documentation of desolve_rk4 in Sage by typing desolve_rk4?. I found it in the online reference manual under Solving differential equations. Please open a new thread about the problem with desolve.

rburing gravatar imagerburing ( 2019-01-11 17:28:16 +0200 )edit
1

answered 2019-01-11 01:00:43 +0200

tmonteil gravatar image

You can add plots in Sage, so in your case:

sage: plot_slope_field(4*y/x+x*sqrt(y),(x,0,4),(y,0,10),headaxislength=3,headlength=3, color='red') + plot(1/4*x^4*(log(x)+2)^2,0,4, ymax=10, color='blue')
edit flag offensive delete link more

Comments

Actually, I want to check if the computed trajectory (by Maxima) coincides with my function graph. Is there a way to combine those plots to one figure via Maxima? Or alternatively, is there a way to make Sage compute trajectories like Maxima does? I need the combination of both abilities, the one by Sage (combining several plots to one) and the other by Maxima (computing/displaying trajectories without having to solve the differential equation manually).

Thrash gravatar imageThrash ( 2019-01-11 04:34:23 +0200 )edit

What feature of maxima is missing in Sage ? The only code from maxima that i see is the plotting, so i just explained how to move that part in Sage.

tmonteil gravatar imagetmonteil ( 2019-01-11 14:23:51 +0200 )edit

Specifying trajectory_at in Maxima produces an integral curve, which you can get in Sage e.g. by desolve_rk4 (see my answer).

rburing gravatar imagerburing ( 2019-01-11 15:24:10 +0200 )edit
1

"What feature of maxima is missing in Sage ?" Computing trajectories. In Maxima, after the direction field has been plotted, you can click on some point and then there will be displayed the corresponding trajectory. A great interactive feature! I haven't seen that in Sage yet.

Thrash gravatar imageThrash ( 2019-01-11 16:26:15 +0200 )edit

Your Answer

Please start posting anonymously - your entry will be published after you log in or create a new account.

Add Answer

Question Tools

1 follower

Stats

Asked: 2019-01-10 20:45:43 +0200

Seen: 916 times

Last updated: Jan 12 '19