Ask Your Question
1

Putting the results of a function as text into a plot

asked 2018-06-05 12:22:19 +0200

SteveF gravatar image

updated 2018-06-06 06:33:42 +0200

slelievre gravatar image

How can I put the results of functions into a plot? I can't find any examples.
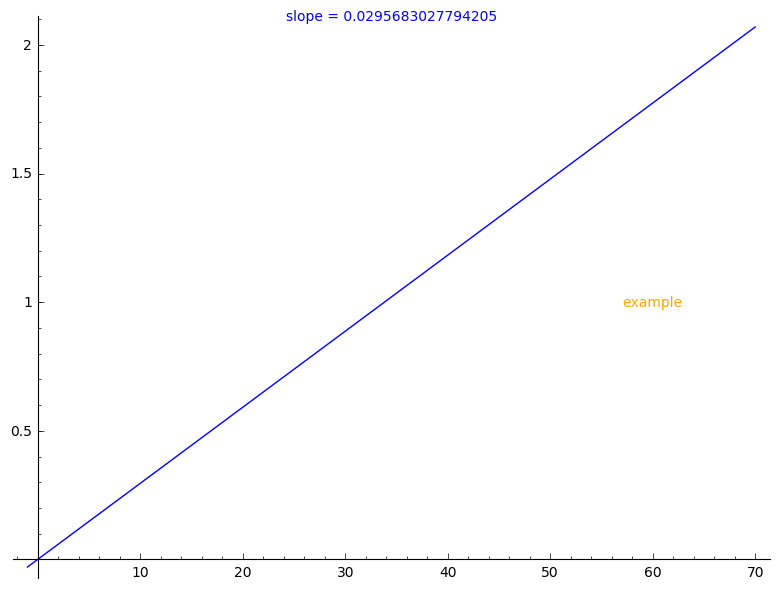
f(x) = x/33.82
plotEquation = plot(f(x), -1, 70) 
equationDifferential = f.diff()(x)
big_image = plotEquation
# big_image = plotEquation + SOME CODE THAT PUTS THE RESULT OF f.diff()(x) in the plot.
big_image.show()
edit retag flag offensive close merge delete

1 Answer

Sort by » oldest newest most voted
2

answered 2018-06-05 22:48:53 +0200

Sébastien gravatar image

You may use text to create a text 2D graphics object and + to join the graphics:

sage: f(x)=x/33.82
sage: plotEquation = plot(f(x),-1,70)
sage: equationDifferential = f.diff()(x)
sage: big_image = plotEquation
sage: equationDifferential
0.0295683027794205
sage: t = text("slope = {}".format(equationDifferential), (.5, 1), axis_coords=True)
sage: s = text("example", (60, 1), color='orange')
sage: big_image = plotEquation + t + s
sage: big_image

image description

Note that axis_coords=True changes the coordinate system as described by the documentation of text:

   * "axis_coords" - (default: False) If True, use axis coordinates,
     so that (0,0) is the lower left and (1,1) upper right, regardless
     of the x and y range of plotted values.
edit flag offensive delete link more

Comments

Thank you very much. I really appreciate your help!

SteveF gravatar imageSteveF ( 2018-06-06 04:57:01 +0200 )edit

@SteveF - if this solves your question, please accept this answer by clicking the "accept" icon (tick mark) at the top left of the answer. This will mark the answer as accepted and your question as solved.

slelievre gravatar imageslelievre ( 2018-06-06 06:31:34 +0200 )edit

In complement to @Sébastien answer, note that you can include mathematical expressions in the displayed text by transforming them into a LaTeX string first: if f(x) is a symbolic function that you have defined, you can do

text("My function: " + "$" + latex(f(x)) + "$", (60, 1))
eric_g gravatar imageeric_g ( 2018-06-06 11:19:23 +0200 )edit

Your Answer

Please start posting anonymously - your entry will be published after you log in or create a new account.

Add Answer

Question Tools

1 follower

Stats

Asked: 2018-06-05 12:20:42 +0200

Seen: 451 times

Last updated: Jun 06 '18