Ask Your Question
1

Plotting in Sage

asked 2018-02-24 19:46:39 +0200

anonymous user

Anonymous

updated 2018-02-24 19:47:49 +0200

I have some numbers in two separate arrays, and I want to plot them in such a way that the end result looks more or less like this:
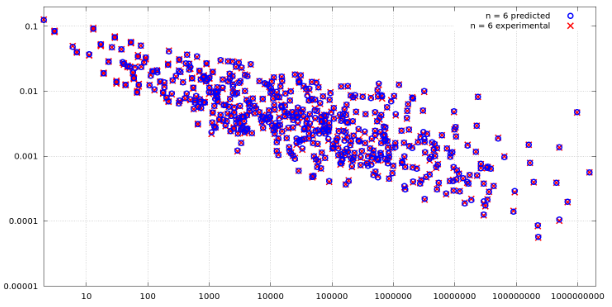
image description

Currently, I have a code that looks like this:

res_blue = [...] # data for the blue circles (removed for brevity)
res_red = [...] # data for the red crosses (removed for brevity)

list_plot(res_red, color='red')

But, instead the above code generates only plot with red dots. How can I combine the two arrays in the same plot, choose their color and the shape to be put in the plot?

edit retag flag offensive close merge delete

1 Answer

Sort by ยป oldest newest most voted
1

answered 2018-02-24 20:58:17 +0200

tmonteil gravatar image

updated 2018-02-24 21:02:35 +0200

The objects returned by list_plot can be added, and result is a plot that is the superposition of the two plots, so you can do:

sage: list_plot(res_red, color='red') + list_plot(res_blue, color='blue')

Regarding the shape, you can set a marker option, for example:

sage: list_plot(res_red, color='red', marker='s') + list_plot(res_blue, color='blue', marker='o')

This will make the red dots as squares and the blue dots as circles.

You can get the list of all markers trough the documentation of the plot function, see:

sage: plot?
edit flag offensive delete link more

Comments

Thanks, this works very well. But, do you have any idea how to created an unfilled circle like in the example above? I noticed that I can use something like marker=r'$\circ$', but then the circle is very thin, and apparently I cannot use either markersize or markerwidth since I have about 200 points in my plot. Do you happen to have any ideas about it?

ninho gravatar imageninho ( 2018-02-24 21:56:42 +0200 )edit

Your Answer

Please start posting anonymously - your entry will be published after you log in or create a new account.

Add Answer

Question Tools

1 follower

Stats

Asked: 2018-02-24 19:46:39 +0200

Seen: 539 times

Last updated: Feb 24 '18