I remain clueless about what you are asking, could you please be more clear? When you say $m\times n$ png, do you mean the size in pixels? What exactly do you mean with "enlargable square pixels"?
However here is an answer to a possible interpretation that was interesting to think about. hth
If your input is a matrix of colors in html format, eg, something that may have been the output of rand_color_matrix (see below).
def rand_html_color():
    return '#'+''.join([hex(randint(0,255))[2:].zfill(2) for i in range(3)])
def rand_color_matrix(m,n):
    return [[rand_html_color() for j in range(n)] for i in range(m)]
Then you can use sage's matrix_plot to generate a png by using plot_color_matrix defined as:
def plot_color_matrix(M):
    L=sorted(flatten(M))
    nrows=len(M)
    ncols=len(M[0])
    m = matrix(ZZ, nrows, ncols)
    for (i,row) in enumerate(M):
        for (j,color) in enumerate(row):
            m[i,j] = L.index(color)
    return matrix_plot(m,cmap=L)
Sage's matrix_plot generates an $m\times n$ array of colored squares where the color of square $i,j$ corresponds to the entry $i,j$ of a given matrix. If you provide a list of colors, say L, then color L[k] is used for entry $i,j$ if the "rank" of that entry is k. The idea behind plot_color_matrix is to get the matrix of colors, generate a list of sorted colors and then just construct a matrix that will make matrix_plot color the entries exactly as they were given in M.
Sample session and output:
sage: %attach color_matrix.sage
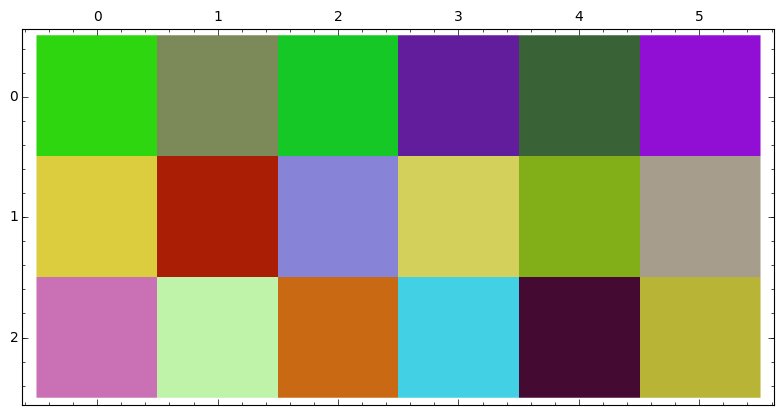
sage: m=rand_color_matrix(3,6)
sage: m
[['#2ed610', '#7c8958', '#15c825', '#621d9c', '#396237', '#910ed4'],
['#dccd3e', '#aa1e06', '#8783d6', '#d3d15c', '#82af18', '#a79d8c'],
['#ca71b6', '#bff3a9', '#c96913', '#42d1e4', '#450a32', '#b8b436']]
sage: plot_color_matrix(m)
A larger example:
sage: plot_color_matrix(rand_color_matrix(200,150))