Ask Your Question
0

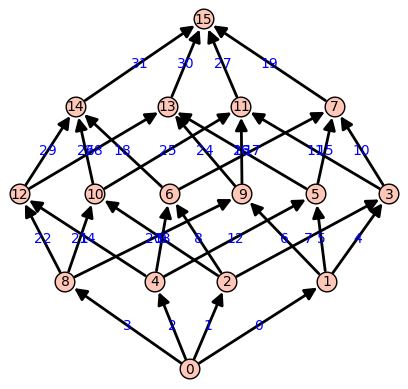
labelling the edges of poset

asked 2015-10-08 09:26:00 +0200

GA316 gravatar image

updated 2016-06-06 21:25:12 +0200

FrédéricC gravatar image

P = SetPartitions(3) f = lambda q,p: q in p.refinements() Po = Poset((P,f))

By using this command I have defined a poset in sage.

Po.show() displays the poset as a directed graph. My question is how to put labels to edges of this graph. when I try to do so, I try to iterate over the edge set like:

for u in Po.edges() :

but sage saying the error message that poset object has no method edges.

Can any one tell me how to put label for this directed graph.

If we define the corresponding Hasse diagram then we can define label, but I want to do label for the edges in the poset but not for the edges in the Hasse diagram. because when we display the pose it looks nice to see, but when we print Hasse diagram it looks little messy.

Thanks for your valuable time.

edit retag flag offensive close merge delete

1 Answer

Sort by » oldest newest most voted
2

answered 2015-10-08 15:27:51 +0200

fidbc gravatar image

If you check the manual for the show method you can see there is an argument called cover_labels. You can use this to put labels. I think that if you want to further manipulate the diagram you'll need to check the manual under the show method for DiGraphs, as this is what is being called through the Poset class.

Po=Posets.BooleanLattice(4)
label={}
for (i,x) in enumerate(Po.cover_relations()):
    label[tuple(x)] = i
Po.show(cover_labels=label)

This produces.

image description

edit flag offensive delete link more

Comments

can you please explain the last line of your coding? thanks a lot.

GA316 gravatar imageGA316 ( 2015-10-09 19:43:17 +0200 )edit

The show method takes an argument called cover_labels (which defaults to None). When you call show with a value for that argument it is used to label the cover relations of the poset. The argument cover_labels should be a dictionary (as in the example above) or a function having the cover relation pairs as keys or domain respectively. Whatever the dictionary/function value is will be used as a label in the diagram.

fidbc gravatar imagefidbc ( 2015-10-10 16:16:36 +0200 )edit

thanks a lot. it woks nicely. one last question. how to format (say to make it bold or bigger the size) the labels added by these commands? thanks.

GA316 gravatar imageGA316 ( 2015-10-12 07:31:28 +0200 )edit

please help me in editing these labels. I have struck at this point.

GA316 gravatar imageGA316 ( 2015-10-14 12:11:52 +0200 )edit

Not sure if that functionality you ask is implemented in sage, sorry!

fidbc gravatar imagefidbc ( 2015-10-14 14:27:50 +0200 )edit

Your Answer

Please start posting anonymously - your entry will be published after you log in or create a new account.

Add Answer

Question Tools

1 follower

Stats

Asked: 2015-10-08 09:26:00 +0200

Seen: 846 times

Last updated: Oct 08 '15