Revision history [back]
| | 1 | initial version |
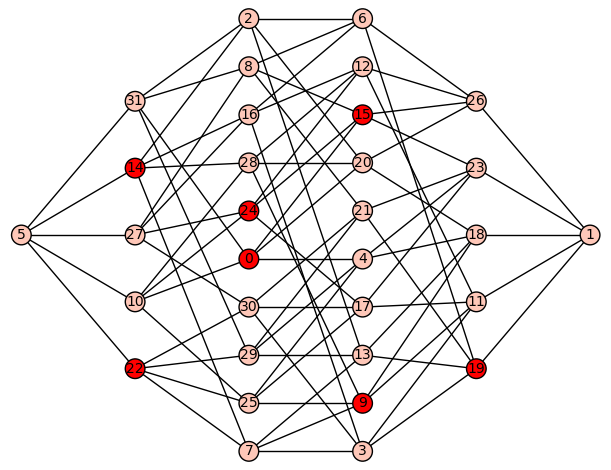
An answer to this question is in the documentation of the cube graph generator (graphs.CubeGraph?) : use parameter embedding.
g1 = graphs.CubeGraph(5, embedding=2)
g1.relabel()
m = g1.dominating_set()
g1.plot(vertex_colors={"red": m})