Revision history [back]
| | 1 | initial version |
What about :
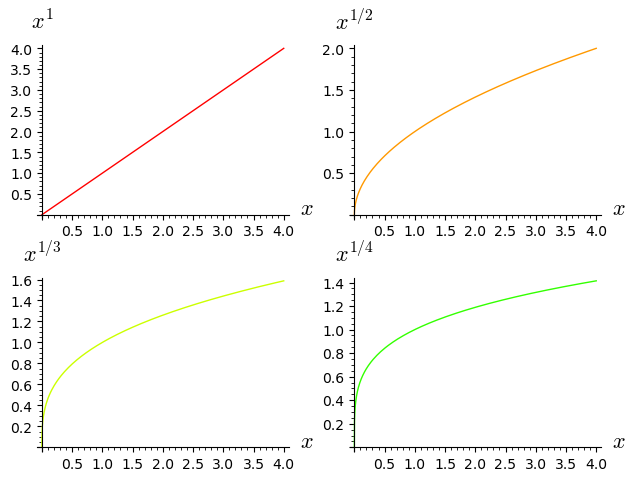
![sage: all=[plot(x^(1/(i+1)),(x,0,4), rgbcolor=hue(i/10),axes_labels=[r"$x$",r"$x^{%s}$"%str(1/(1+i))]) for i in range(4)]
sage: graphics_array(all, 2, 2)
Launched png viewer for Graphics Array of size 2 x 2]
(/upfiles/16496235144603474.png)
| | 2 | No.2 Revision |
What about :
![sage: all=[plot(x^(1/(i+1)),(x,0,4), rgbcolor=hue(i/10),axes_labels=[r"$x$",r"$x^{%s}$"%str(1/(1+i))]) for i in range(4)]
sage: graphics_array(all, 2, 2)
Launched png viewer for Graphics Array of size 2 x 2]
(/upfiles/16496235144603474.png)