Revision history [back]
| | 1 | initial version |
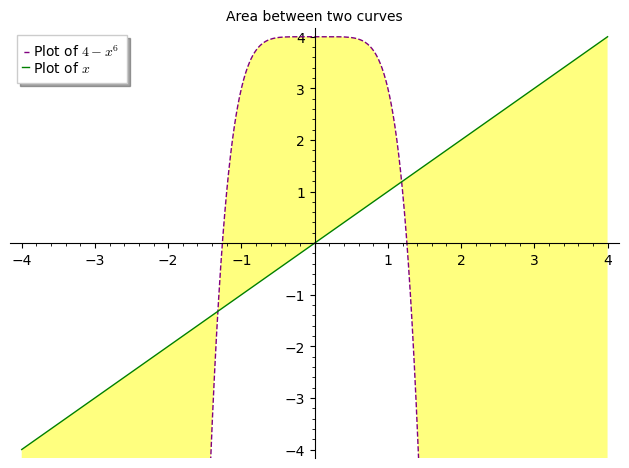
Hello, @Sagematherireland! You are in the right track (you almost got it done!) The fill argument for the plot command can take on the value of a function, in which case, it will fill the area between the curves. Here is an example that I believe should produce the result you expected:
f(x) = 4 - x^6
g(x) = x
P1 = plot(f, (-4,4), color='purple', linestyle='dashed', fill=g, fillcolor='yellow', legend_label='Plot of $4-x^6$')
P2 = plot(g, (-4,4), color='green', title="Area between two curves", legend_label='Plot of $x$')
show(P1+P2, ymin=-4, ymax=4)
Notice I have changed the fill=True argument to fill=g. I also used the fillcolor argument in the first plot just for fun. Here is the result:
| | 2 | No.2 Revision |
Hello, @Sagematherireland! You are in the right track (you almost got it done!) The fill argument for the plot command can take on the value of a function, in which case, it will fill the area between the curves. Here is an example that I believe should produce the result you expected:
f(x) = 4 - x^6
g(x) = x
P1 = plot(f, (-4,4), color='purple', linestyle='dashed', fill=g, fillcolor='yellow', legend_label='Plot of $4-x^6$')
P2 = plot(g, (-4,4), color='green', title="Area between two curves", legend_label='Plot of $x$')
show(P1+P2, ymin=-4, ymax=4)
Notice I have changed the fill=True argument to fill=g. I also used the fillcolor argument in the first plot just for fun. Here is the result:
Hope this helps!
