Revision history [back]
 | 1 | initial version |
Use the option linewidth=0.5 in implicit_plot().
 | 2 | No.2 Revision |
Use the option linewidth=0.5 in implicit_plot().
Let us illustrate the difference.
Some setup.
sage: p(x, y) = x * y
sage: xx = yy = (-9, 9)
sage: uu = range(-3, 2)
sage: opt = dict(linewidth=0.5)
sage: col = lambda u: Color(sin(u**3/10), 1.0, 1, space='hsv')
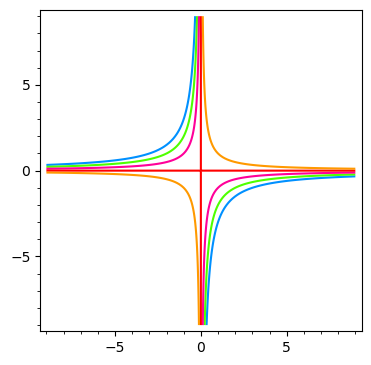
Implicit plots with default line width.
sage: sum(implicit_plot(p - u, xx, yy, color=col(u)) for u in uu)

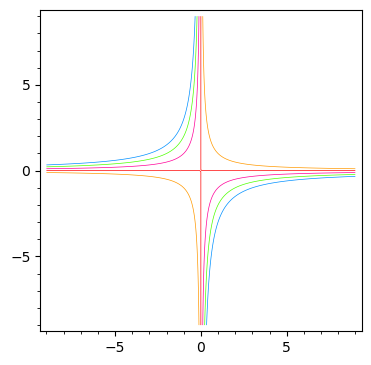
Implicit plots with line width 0.5.
sage: sum(implicit_plot(p - u, xx, yy, color=col(u), linewidth=0.5) for u in uu)

