Revision history [back]
| | 1 | initial version |
For some reason, the plot is not correct.
You mean that xmin and xmax are not honored ? See Trac#16686 and the ticket-chain referenced...
Workaround :
sage: def ininterval(x,l,u):return float(x) if x>l and x<u else float("NaN")
sage: plot([lambda t:ininterval(8*(6+t)/(t^2-16),-3,3),lambda t:ininterval(2*(8+ 3 *t)/(t^2-16),-3,3)], (t,-6,6), axes_labels=["x","y"], parametric=True)
verbose 0 (3839: plot.py, generate_plot_points) WARNING: When plotting, failed to evaluate function at 130 points.
verbose 0 (3839: plot.py, generate_plot_points) Last error message: 'Unable to compute f(6.0)'
Launched png viewer for Graphics object consisting of 2 graphics primitives
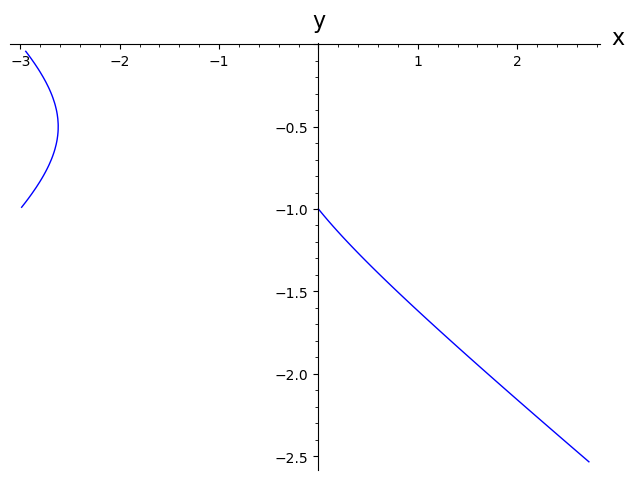
has three branches.
Nope.
What are the possible values of x and y for $t\in[-6~6]$ ? An analytical solution is possible by solving x and y for t then solving the inequations for $t\in|-5~6]$, but is somewhat painful... A graphical solution is easier to grasp :
sage: plot([lambda t:ininterval(8*(6+t)/(t^2-16),-30,30),lambda t:ininterval(2*(8+ 3 *t)/(t^2-16),-30,30)], (t,-6,6), axes_labels=["t",""], legend_label=["x","y"])+plot([-3, 3],(-6,6),color=["green","red"])
verbose 0 (3839: plot.py, generate_plot_points) WARNING: When plotting, failed to evaluate function at 14 points.
verbose 0 (3839: plot.py, generate_plot_points) Last error message: 'Unable to compute f(4.325615967306306)'
Launched png viewer for Graphics object consisting of 8 graphics primitives
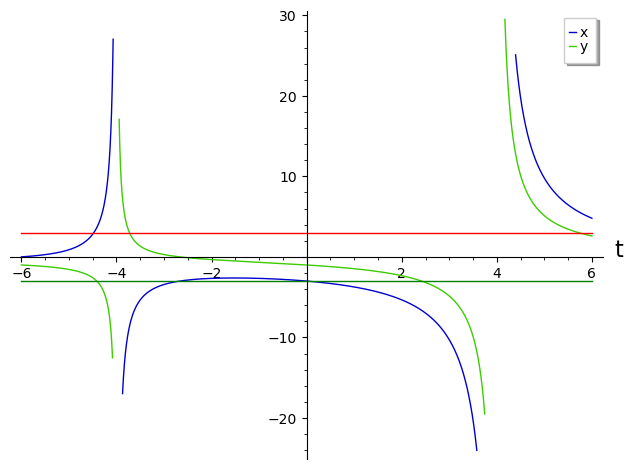
The most limiting variable is x, which is positive and <3 for t>-6, t> -9/2 approximately, and slightly superior to -3 for t>-3, t<0 approximately.
How to plot the branches in different colors ?
The painful analytical solution I studiously avoided above is necessary to define the different regions; the color= argument can then be built around this definition (left tothe reader as an exercise;-)...
| | 2 | No.2 Revision |
For some reason, the plot is not correct.
You mean that xmin and xmax are not honored ? See Trac#16686 and the ticket-chain referenced...
Workaround :
sage: def ininterval(x,l,u):return float(x) if x>l and x<u else float("NaN")
sage: plot([lambda t:ininterval(8*(6+t)/(t^2-16),-3,3),lambda t:ininterval(2*(8+ 3 *t)/(t^2-16),-3,3)], (t,-6,6), axes_labels=["x","y"], parametric=True)
verbose 0 (3839: plot.py, generate_plot_points) WARNING: When plotting, failed to evaluate function at 130 points.
verbose 0 (3839: plot.py, generate_plot_points) Last error message: 'Unable to compute f(6.0)'
Launched png viewer for Graphics object consisting of 2 graphics primitives
has three branches.
Nope.
What are the possible values of x and y for $t\in[-6~6]$ ? An analytical solution is possible by solving x and y for t then solving the inequations for $t\in|-5~6]$, but is somewhat painful... A graphical solution is easier to grasp :
sage: plot([lambda t:ininterval(8*(6+t)/(t^2-16),-30,30),lambda t:ininterval(2*(8+ 3 *t)/(t^2-16),-30,30)], (t,-6,6), axes_labels=["t",""], legend_label=["x","y"])+plot([-3, 3],(-6,6),color=["green","red"])
verbose 0 (3839: plot.py, generate_plot_points) WARNING: When plotting, failed to evaluate function at 14 points.
verbose 0 (3839: plot.py, generate_plot_points) Last error message: 'Unable to compute f(4.325615967306306)'
Launched png viewer for Graphics object consisting of 8 graphics primitives
The most limiting variable is x, which is positive and <3 for t>-6, t> -9/2 approximately, and slightly superior to -3 for t>-3, t<0 approximately.
How to plot the branches in different colors ?
The painful analytical solution I studiously avoided above is necessary to define the different regions; the color= argument can then be built around this definition (left tothe reader as an exercise;-)...
HTH,
| | 3 | No.3 Revision |
For some reason, the plot is not correct.
You mean that xmin and xmax are not honored ? See Trac#16686 and the ticket-chain referenced...
Workaround :
sage: def ininterval(x,l,u):return float(x) if x>l and x<u else float("NaN")
sage: plot([lambda t:ininterval(8*(6+t)/(t^2-16),-3,3),lambda t:ininterval(2*(8+ 3 *t)/(t^2-16),-3,3)], (t,-6,6), axes_labels=["x","y"], parametric=True)
verbose 0 (3839: plot.py, generate_plot_points) WARNING: When plotting, failed to evaluate function at 130 points.
verbose 0 (3839: plot.py, generate_plot_points) Last error message: 'Unable to compute f(6.0)'
Launched png viewer for Graphics object consisting of 2 graphics primitives
has three branches.
Nope.
What are the possible values of x and y for $t\in[-6~6]$ ? An analytical solution is possible by solving x and y for t then solving the inequations for $t\in|-5~6]$, but is somewhat painful... A graphical solution is easier to grasp :
sage: plot([lambda t:ininterval(8*(6+t)/(t^2-16),-30,30),lambda t:ininterval(2*(8+ 3 *t)/(t^2-16),-30,30)], (t,-6,6), axes_labels=["t",""], legend_label=["x","y"])+plot([-3, 3],(-6,6),color=["green","red"])
verbose 0 (3839: plot.py, generate_plot_points) WARNING: When plotting, failed to evaluate function at 14 points.
verbose 0 (3839: plot.py, generate_plot_points) Last error message: 'Unable to compute f(4.325615967306306)'
Launched png viewer for Graphics object consisting of 8 graphics primitives
The most limiting variable is x, which is positive and <3 for t>-6, t> -9/2 approximately, and slightly superior to -3 for t>-3, t<0 approximately.
How to plot the branches in different colors ?
The painful analytical solution I studiously avoided above is necessary to define the different regions; the color= argument can then be built around this definition (left tothe reader as an exercise;-)...
EDIT : after addition of another question...
A static version of your chronogram could be :
var("t")
fx(t)=8*(6+t)/(t^2-16)
fy(t)=2*(8+ 3 *t)/(t^2-16)
def ininterval(x,l,u):return float(x) if x>l and x<u else float("NaN")
P=plot([lambda t:ininterval(fx(t),-3,3), lambda t:ininterval(fy(t),-3,3)],
       (t,-6,6), axes_labels=["x","y"], parametric=True)
Pts=[]
T=[]
xmin=P.xmin()
xmax=P.xmax()
ymin=P.ymin()
ymax=P.ymax()
for t in srange(-6,6.1,0.1):
    px=fx(t)
    py=fy(t)
    if px>=xmin and px<=xmax and py>=xmin and py<=ymax:
        Pts+=[(px,py)]
        T+=[text("%4.1f"%t,(px,py),
                 vertical_alignment="bottom",
                 horizontal_alignment="left",
                 color="black")]
sage: show(P+points(Pts)+sum(T))
Launched png viewer for Graphics object consisting of 43 graphics primitives
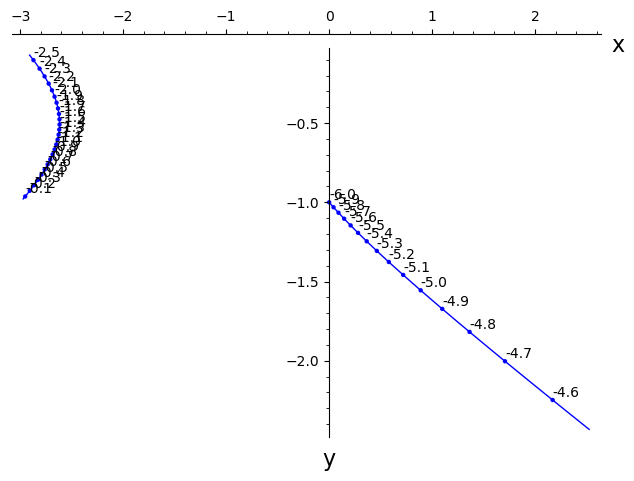
An animated/interactive version is left to the reader of the documentation as an exercise...
HTH,
