Revision history [back]
| | 1 | initial version |

Instead of the hue, as suggested by @slelievre, you could use colors extracted from a color map. For example, borrowing and slightly modifying slelievre's code, you could write:
tau = 2*pi
ngon = lambda n: [(n*cos(k*tau/n), n*sin(k*tau/n)) for k in range(n+1)]
point_lists = [ngon(n) for n in range(3, 13, 2)]
n = len(point_lists)
ops = dict(plotjoined=True, markeredgecolor="black", marker="s")
col = lambda c: colormaps.Dark2(c)[0:3]
G = sum(list_plot(point_list, color=col(k/n), **ops)
        for k, point_list in enumerate(point_lists))
G.show(aspect_ratio=1,frame=True)
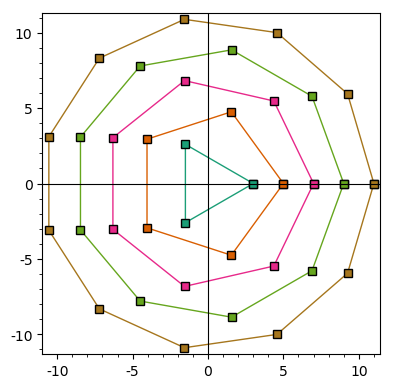
You could replace colormaps.Dark2 by, say, colormaps.jet, colormaps.Blues, etc. For a complete list of predefined color maps, type list(colormaps).
