Revision history [back]
 | 1 | initial version |
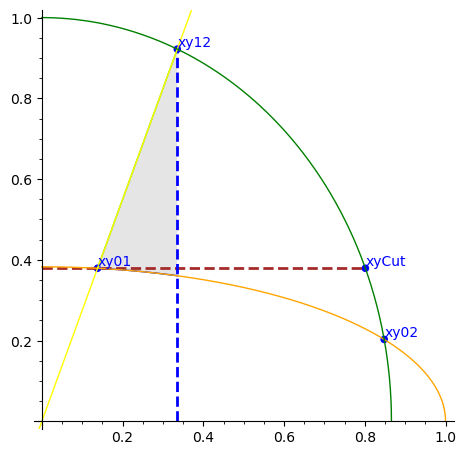
For the shaded region, use the interval from [x01, x12] instead of [0, 1].
Besides, using parametric plots for the ellipse arcs will give more satisfactory results than plotting them as graphs of functions.
Indeed, those functions have vertical tangents and it is all too easy to miss the neighbourhood of vertical tangency points when plotting such functions.
var('x')
PtsL = [[0.13795, 0.37902], [0.33554, 0.92189], [0.84803, 0.2028], [0.80141, 0.37902]]
PtsNamesL = ['xy01', 'xy12', 'xy02', 'xyCut']
ellipse0 = 1/2*sqrt(-x^2 + 1)*sqrt(-sqrt(2) + 2)
ellipse1 = x*cos(1/9*pi)/sin(1/9*pi)
ellipse2 = sqrt(-4/3*x^2 + 1)
plt = list_plot(PtsL, color='blue', size=30)
pt_opt = {'color': 'blue', 'horizontal_alignment': 'left', 'vertical_alignment': 'bottom'}
plt += sum(text(name, vector(pt), **pt_opt) for name, pt in zip(PtsNamesL, PtsL))
plt += line([[0, PtsL[3][1]], PtsL[3]], color='brown', thickness=2, linestyle='dashed')
plt += line([[PtsL[1][0], 0], PtsL[1]], color='blue', thickness=2, linestyle='dashed')
plt += plot([ellipse0, ellipse1], (PtsL[0][0], PtsL[1][0]), fill={0: [1]}, fillcolor='#ccc')
ell0 = (lambda t: sqrt(A0)*cos(t), lambda t: sqrt(B0)*sin(t))
plt += parametric_plot(ell0, (0, pi/2), color='orange')
plt += plot(ellipse1, color='yellow')
ell2 = (lambda t: sqrt(A2)*cos(t), lambda t: sqrt(B2)*sin(t))
plt += parametric_plot(ell2, (0, pi/2), color='green')
plt.show(xmin=0, xmax=1, ymin=0, ymax=1, aspect_ratio=1, figsize=8)

 | 2 | No.2 Revision |
For the shaded region, use the interval from [x01, x12] instead of [0, 1].
Besides, using use parametric plots for the nicer ellipse arcs will give more satisfactory
results arcs
than when plotted as function graphs.
Indeed, plotting them as graphs of functions.
Indeed, those functions have with vertical tangents and it typically goes wrong
near those tangencies.
Here is all too easy to miss
the neighbourhood of vertical tangency points when plotting such functions.some amended code.
var('x')
PtsL = [[0.13795, 0.37902], [0.33554, 0.92189], [0.84803, 0.2028], [0.80141, 0.37902]]
PtsNamesL pts = [(0.13795, 0.37902), (0.33554, 0.92189), (0.84803, 0.2028), (0.80141, 0.37902)]
pt_names = ['xy01', 'xy12', 'xy02', 'xyCut']
ellipse0 = 1/2*sqrt(-x^2 + 1)*sqrt(-sqrt(2) + 2)
ellipse1 = x*cos(1/9*pi)/sin(1/9*pi)
ellipse2 = sqrt(-4/3*x^2 + 1)
plt = list_plot(PtsL, A0, B0 = 1, (2 - sqrt(2))/4
A2, B2 = 3/4, 1
f0 = sqrt((1 - x^2/A0)*B0)
f1 = x*cot(pi/9)
f2 = sqrt((1 - x^2/A2)*B2)
plt = point2d(pts, color='blue', size=30)
pt_opt = {'color': 'blue', 'horizontal_alignment': 'left', 'vertical_alignment': 'bottom'}
plt += sum(text(name, vector(pt), **pt_opt) for name, pt in zip(PtsNamesL, PtsL))
zip(pt_names, pts))
plt += line([[0, PtsL[3][1]], PtsL[3]], pts[3][1]], pts[3]], color='brown', thickness=2, linestyle='dashed')
plt += line([[PtsL[1][0], line([[pts[1][0], 0], PtsL[1]], pts[1]], color='blue', thickness=2, linestyle='dashed')
plt += plot([ellipse0, ellipse1], (PtsL[0][0], PtsL[1][0]), fill_opt = {'fillcolor': 'lightgrey', 'thickness': 0}
plt += plot([f0, f1], (pts[0][0], pts[1][0]), fill={0: [1]}, fillcolor='#ccc')
**fill_opt)
ell0 = (lambda t: sqrt(A0)*cos(t), lambda t: sqrt(B0)*sin(t))
plt += parametric_plot(ell0, (0, pi/2), color='orange')
plt += plot(ellipse1, plot(f1, color='yellow')
ell2 = (lambda t: sqrt(A2)*cos(t), lambda t: sqrt(B2)*sin(t))
plt += parametric_plot(ell2, (0, pi/2), color='green')
plt.show(xmin=0, xmax=1, ymin=0, ymax=1, aspect_ratio=1, figsize=8)

