Revision history [back]
 | 1 | initial version |
We adapt the method provided in an answer to
Ask Sage question 54878
and define a function that provides an iterator over
graphs on n vertices with the requested property.
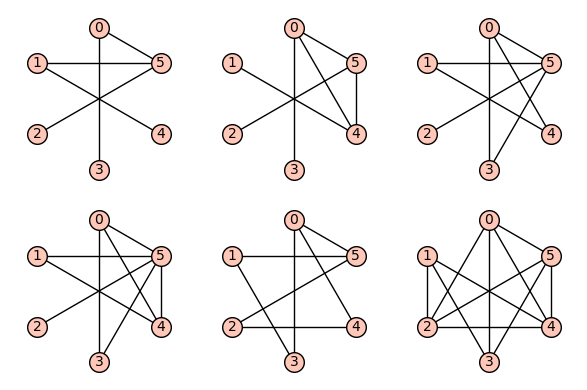
We then treat the case of n = 6 as an example, and plot all the corresponding graphs.
Function:
def mygraphs(n):
    return (g for g in graphs.nauty_geng(f"{n} -c")
            if all(e and (1/e in ee or -1/e in ee)
                   for ee in [g.adjacency_matrix().eigenvalues()]
                   for e in ee))
List of graphs on 6 vertices with the requested property
sage: G6 = list(mygraphs(6))
sage: len(G6)
6
View them:
sage: opt = {'axes': False, 'aspect_ratio': 1, 'color': 'grey', 'alpha': 0}
sage: p = point2d([(-1.2, -1.2), (1.2, 1.2)], **opt)
sage: gg = [p + g.plot(layout='circular') for g in G6]
sage: graphics_array(gg, ncols=3)
 | 2 | No.2 Revision |
We adapt the method provided in an answer to
Ask Sage question 54878
and define a function that provides an iterator over
graphs on n vertices with the requested property.
We then treat the case of n = 6 as an example, and plot all the corresponding graphs.
Function:
def mygraphs(n):
    return (g for g in graphs.nauty_geng(f"{n} -c")
            if all(e and (1/e in ee or -1/e in ee)
                   for ee in [g.adjacency_matrix().eigenvalues()]
                   for e in ee))
List of graphs on 6 vertices with the requested property
sage: G6 = list(mygraphs(6))
sage: len(G6)
6
View them:
sage: opt = {'axes': False, 'aspect_ratio': 1, 'color': 'grey', 'alpha': 0}
sage: p = point2d([(-1.2, -1.2), (1.2, 1.2)], **opt)
sage: gg = [p + g.plot(layout='circular') for g in G6]
sage: graphics_array(gg, ncols=3)

