Revision history [back]
| | 1 | initial version |
Graphs on 6 vertices with eigenvalue condition
SageMath can call Nauty for enumerating graphs up to isomorphism.
This is done via the graphs.nauty_geng command.
Then one can filter by checking the conditions in the question (which amount to the set of eigenvalues avoiding zero and being stable by opposite and by inverse).
Define the requested list using nauty_geng and list comprehension.
sage: gg = [g for g in graphs.nauty_geng("6")
....:       if all(e and -e in ee and 1/e in ee
....:              for ee in [g.adjacency_matrix().eigenvalues()]
....:              for e in ee)]
Some graphics options and positioning for plotting:
sage: pos = dict(enumerate([(2, 1), (0, 2), (2, 0), (1, 1), (3, 2), (1, 0)]))
sage: opt = {'xmin': -0.5, 'xmax': 3.5, 'ymin': -0.5, 'ymax': 2.5}
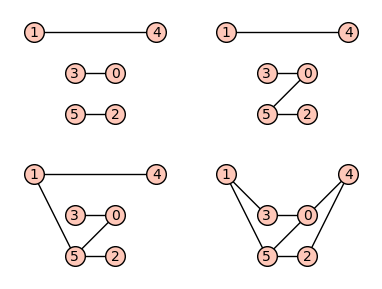
The four graphs:
sage: p = graphics_array([g.plot(pos=pos, **opt) for g in gg], ncols=2)
sage: p.show(figsize=4)

sage: filename = "ask-54878-graphs-n6-eigencondition.png"
sage: p.save(filename, transparent=True, figsize=4)
| | 2 | No.2 Revision |
Graphs on 6 vertices with eigenvalue condition
SageMath can call Nauty for enumerating graphs up to isomorphism.
This is done via the graphs.nauty_geng command.
Then one can filter by checking the conditions in the question (which amount to the set of eigenvalues avoiding zero and being stable by opposite and by inverse).
Define the requested list using nauty_geng and list comprehension.
sage: gg = [g for g in graphs.nauty_geng("6")
....:       if all(e and -e in ee and 1/e in ee
....:              for ee in [g.adjacency_matrix().eigenvalues()]
....:              for e in ee)]
Some graphics options and positioning for plotting:
sage: pos = dict(enumerate([(2, 1), (0, 2), (2, 0), (1, 1), (3, 2), (1, 0)]))
sage: opt = {'xmin': -0.5, 'xmax': 3.5, 'ymin': -0.5, 'ymax': 2.5}
The four graphs:
sage: p = graphics_array([g.plot(pos=pos, **opt) for g in gg], ncols=2)
sage: p.show(figsize=4)
To save the picture to a file:
sage: filename = "ask-54878-graphs-n6-eigencondition.png"
sage: p.save(filename, transparent=True, figsize=4)
nauty_geng("6 -c") instead of nauty_geng("6"). 