Revision history [back]
| | 1 | initial version |
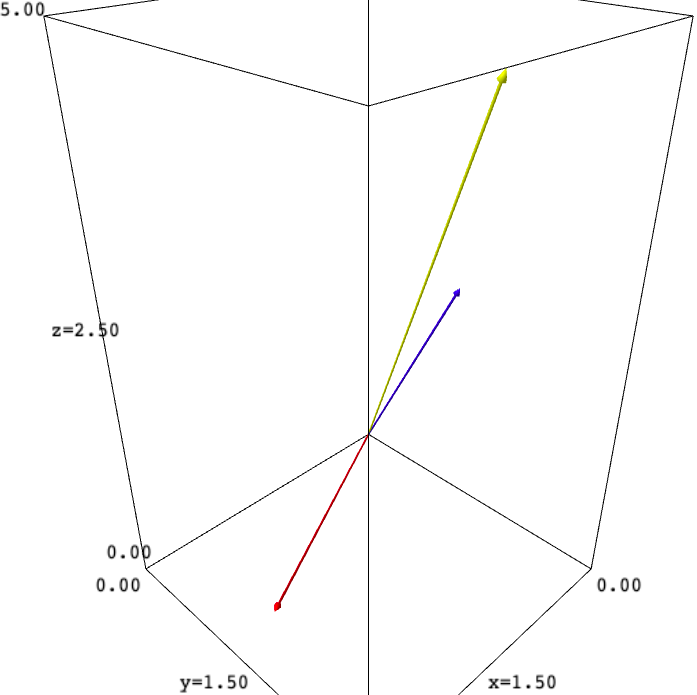
On macOS 10.14.6 with Sage 9.2.beta13, the code in the question gives a plot with arrows and colors.
| | 1 | initial version |
On macOS 10.14.6 with Sage 9.2.beta13, the code in the question gives a plot with arrows and colors.
 Copyright Sage, 2010. Some rights reserved under creative commons license. Content on this site is licensed under a Creative Commons Attribution Share Alike 3.0 license.