Revision history [back]
 | 1 | initial version |
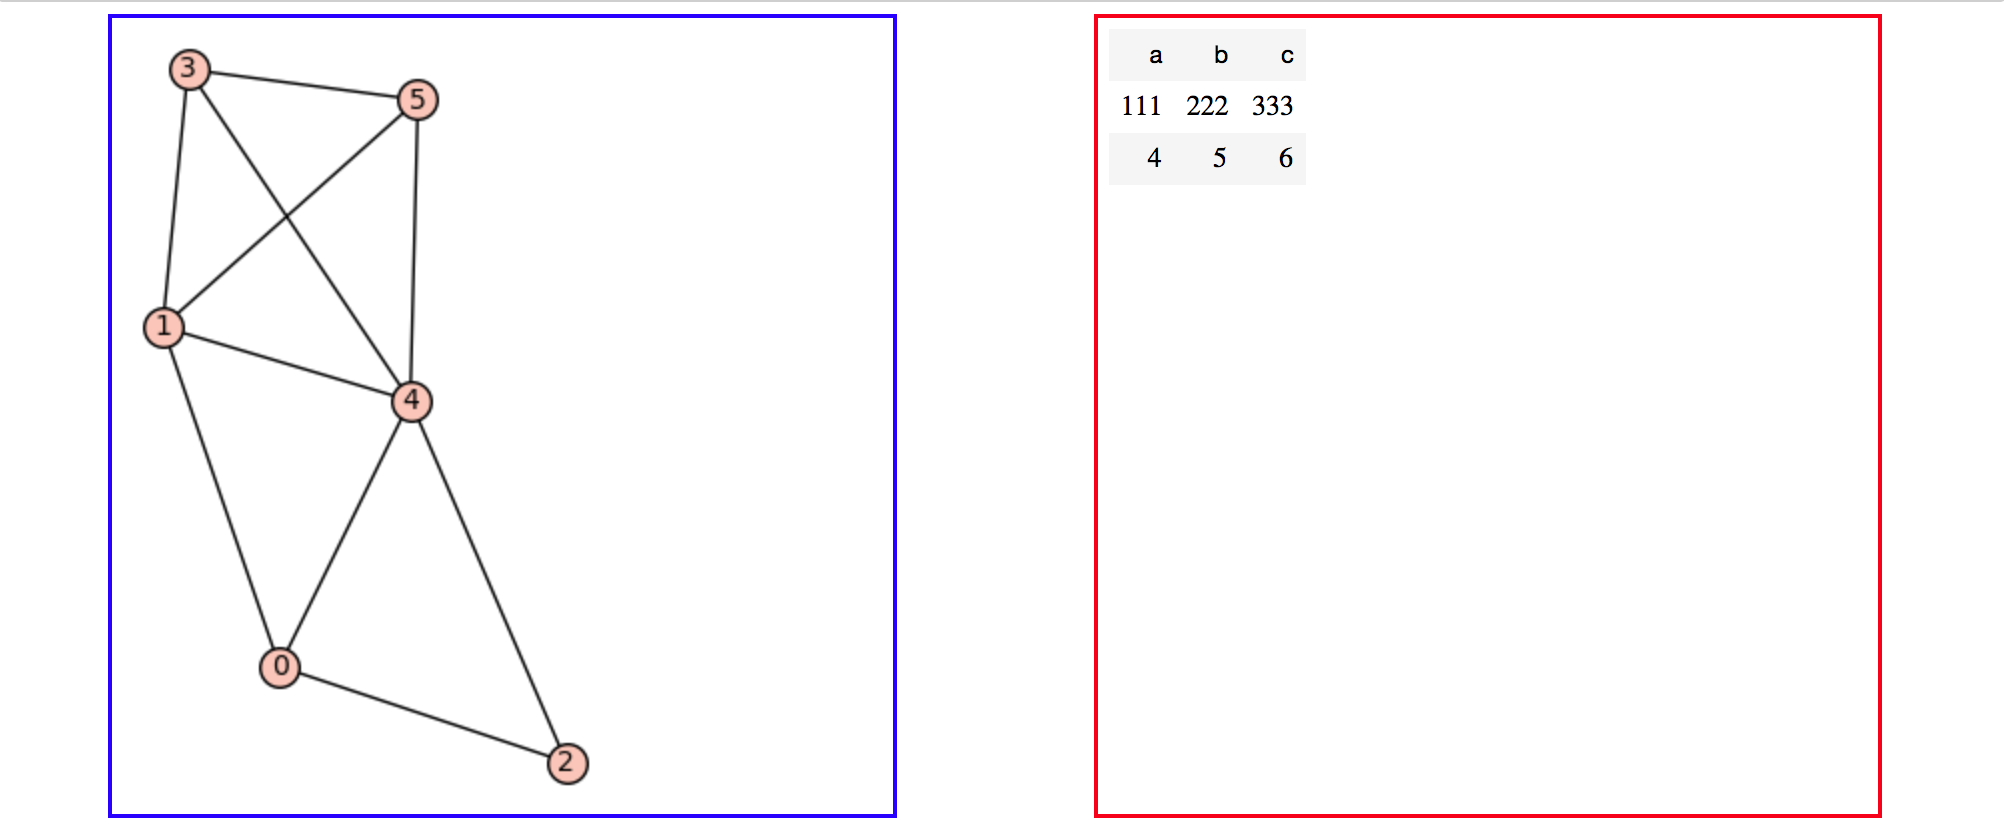
The align=right option acts inside the table, not outside. So, to put the graph and the table in parallel, you can use Jupyter widgets. The following code implements this idea:
import ipywidgets as widgets

T = table([['a', 'b', 'c'], [111,222,333],[4,5,6]])
T.options(align='right')
G = Graph({0:[1,2],2:[0,4],3:[1,4],4:[1,0],5:[1,3,4]})

# Define left and right containers where to place output
output_l = widgets.Output(layout={'border': '2px solid blue', 'width': '40%'})
output_r = widgets.Output(layout={'border': '2px solid red', 'width': '40%'})

# Fill left container
with output_l:
    show(G)
# Fill right container
with output_r:
    show(T)

# Show containers
widgets.HBox([output_l,output_r], layout={'justify_content':'space-around'})
This is the result:

Of course, you can modify the properties of each container to meet your needs.

