|   | 1 |  initial version  | 
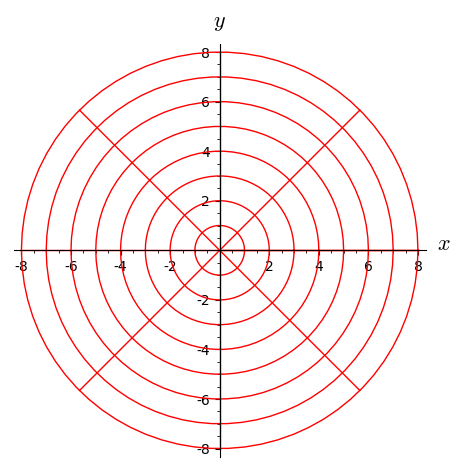
For the gridlines, you can do:
sage: E = EuclideanSpace(2)
sage: polar.<r, theta> = E.polar_coordinates()
sage: polar.plot(E.cartesian_coordinates())

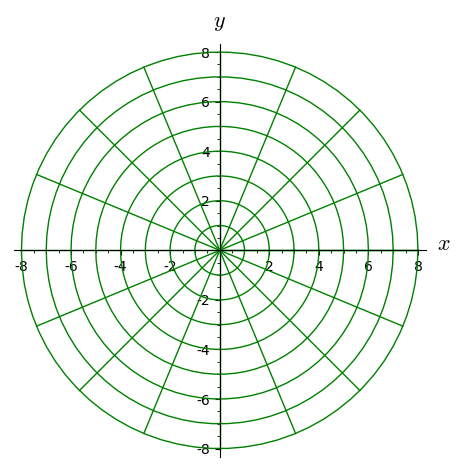
See this page for all plot options. For instance:
sage: polar.plot(E.cartesian_coordinates(), number_values={r: 9, theta: 17}, color='green')

 Copyright Sage, 2010. Some rights reserved under creative commons license. Content on this site is licensed under a Creative Commons Attribution Share Alike 3.0 license.
 
                
                Copyright Sage, 2010. Some rights reserved under creative commons license. Content on this site is licensed under a Creative Commons Attribution Share Alike 3.0 license.