Revision history [back]
| | 1 | initial version |
Hello, @SYLA. As SageMath uses Matplotlib as its backend for plotting, you should import the amssymb package using Matplotlib itself. The only way I can find to do this is the following:
from matplotlib import rc
rc('text', usetex=True)
rc('text.latex', preamble=r'\usepackage{amssymb}')
plot(x, (x,-1,10), axes_labels=[r'$F(G\,\square\,H)$',r'$F(G\,\times\,H)$']).show()
Here is the result:
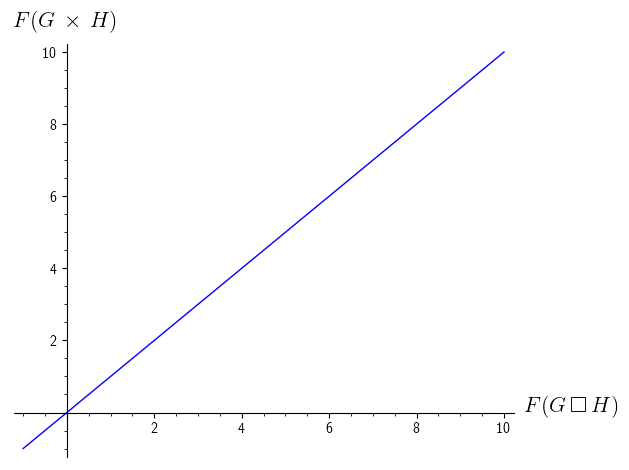
First, we import rc from Matplotlib, which is used to specify configurations. In the second line, we use rc to specify the use of LaTeX as default renderer for text. The third line indicates that we want to add the amssymb package, which defines the \square command you need. Finally, we use Sage's command for plotting.
The interesting thing is that Sage first processes the plot command, and then passes it to Matplotlib for plotting, and that is when our new configurations take effect.
I hope this helps!
