Revision history [back]
| | 1 | initial version |
Since you didn't show the first and the second attempt to get g1, we can only guess.
var("x, y")
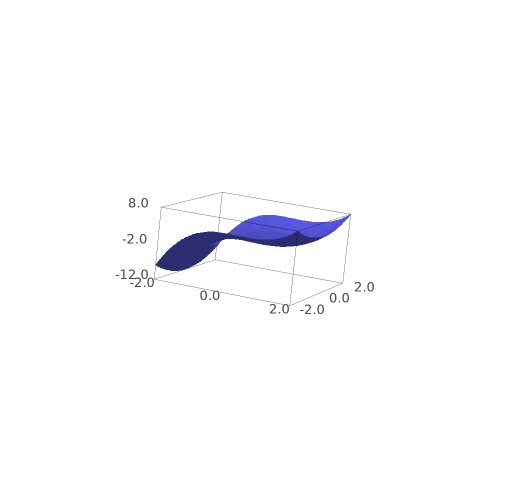
f(x,y)=x^3-x^2+y^2
# BTW, the correct name is "Spectral", not "spectral"...
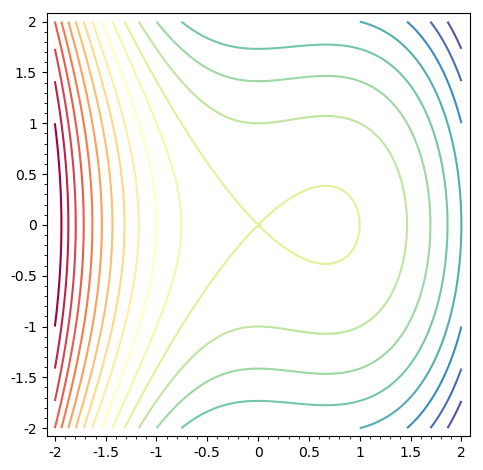
g1 = contour_plot(f(x,y),(x,-2,2),(y,-2,2),
contours=20,fill=False,cmap='Spectral')
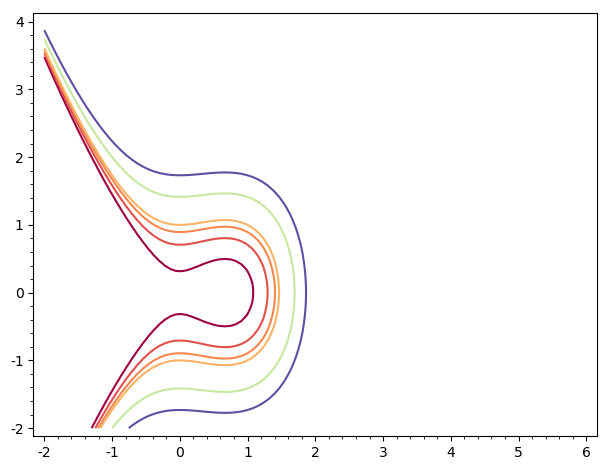
g1prime = contour_plot(f(x,y),(x,-2,6),(y,-2,4),
contours=[1/10,1/2,4/5,1,2,3],cmap='Spectral',fill=False)
for me, g1 is
and g1prime is
They are obviously different, since you changed:
- the ranges, and
- the contours specification.
Now, adding
g2=plot_vector_field(f.gradient(), (x, -2, 2), (y, -2, 2))
to the first graph (same range specification) gives me
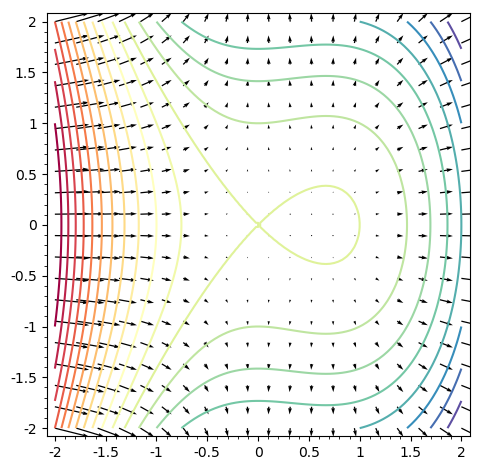
which does not look that unreasonable...
| | 2 | No.2 Revision |
Since you didn't show the first and the second attempt to get g1, we can only guess.
var("x, y")
f(x,y)=x^3-x^2+y^2
# BTW, the correct name is "Spectral", not "spectral"...
g1 = contour_plot(f(x,y),(x,-2,2),(y,-2,2),
                  contours=20,fill=False,cmap='Spectral')
g1prime = contour_plot(f(x,y),(x,-2,6),(y,-2,4),
                       contours=[1/10,1/2,4/5,1,2,3],cmap='Spectral',fill=False)
for me, g1 is
and g1prime is
They are obviously different, since you changed:
- the ranges, and
- the contours specification.
Now, adding
g2=plot_vector_field(f.gradient(), (x, -2, 2), (y, -2, 2))
to the first graph (same range specification) gives me
which does not look that unreasonable...