Revision history [back]
 | 1 | initial version |
Btw, it would be even better if I could put that label on the top centre above the animation.
To do this, use the title keyword instead of legend_label.
 | 2 | No.2 Revision |
You have to call set_legend_options on the individual plots after they're created.
For simplicity, define a helper function which creates the individual plots (so you can call set_legend_options there):
step=0.2;
var('x,y');
def my_plot(k):
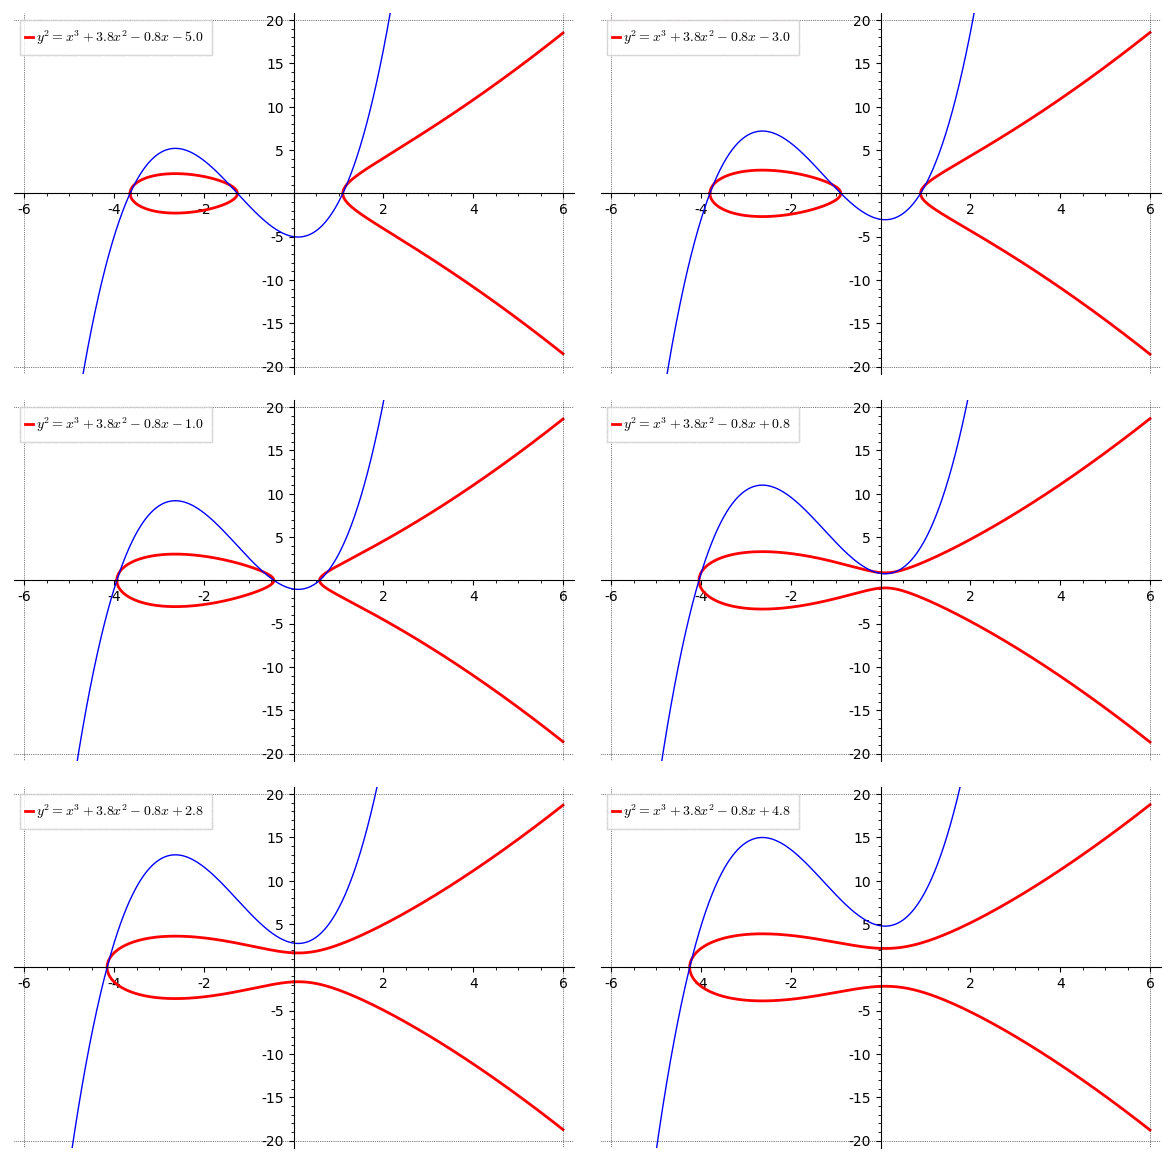
    P = plot(EllipticCurve(y^2==x^3+3.8*x^2-0.8*x+float(k)),xmin=-6,xmax=0,color="red",thickness=2,legend_label=r'$y^2=x^3+3.8x^2-0.8x' + ('+' if k >=0 else '') + '{0:.1f}$'.format(float(k)))
    P += plot(EllipticCurve(y^2==x^3+3.8*x^2-0.8*x+float(k)),xmin=10^(-9),xmax=6,color="red",thickness=2)
    P += plot(x^3+3.8*x^2-0.8*x+float(k),xmin=-6,xmax=6,color="blue",thickness=1)
    P.set_legend_options(shadow=False, loc=2)
    return P
a=animate([my_plot(k) for k in srange(-5,5,step)],xmin=-6,xmax=6,ymin=-20,ymax=20,gridlines=[[-6,6],[-20,20]]);
a.show(delay=1)

I also fixed the legend_label so the number is rounded and it shows + or - correctly.
Original (bad) answer:
Btw, it would be even better if I could put that label on the top centre above the animation.
To do this, use the title keyword instead of legend_label.

