Revision history [back]
| | 1 | initial version |
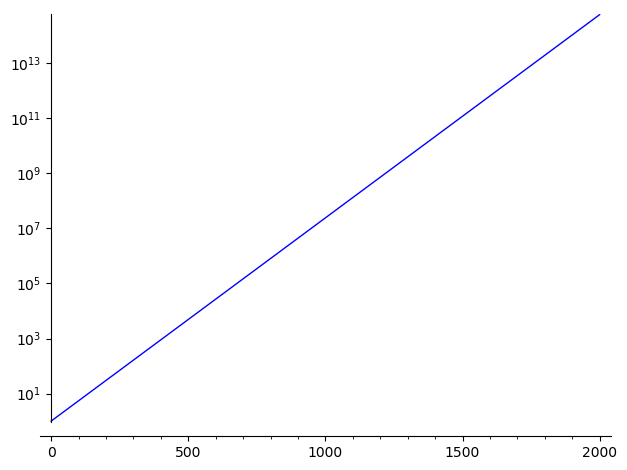
An alternative is to use the log scale on the y-axis:
sage: plot(exp(0.017*x), (x,0,2000), scale="semilogy")
Note that you may change the base of the logarithm this way:
sage: plot(exp(0.017*x), (x,0,2000), scale=("semilogy",3))

See documentation of plot? for more information.
