Revision history [back]
| | 1 | initial version |

The Sage interface is the other way around; the numerical ODE solver desolve_rk4 can produce a plot:
var('x,y')
ode_rhs = 4*y/x+x*sqrt(y)
slope_field = plot_slope_field(ode_rhs, (x,0,4), (y,0,10), headaxislength=3, headlength=3, color='darkred')
exact_sol = plot(lambda x: 1/4*x^4*(log(x)+2)^2, xmin=0, xmax=4, ymin=0, ymax=10, color='blue')
integral_curve = desolve_rk4(ode_rhs, y, ivar=x, ics=[1,1], output='plot', xmax=4, ymax=10, color='yellow')
slope_field + exact_sol + integral_curve
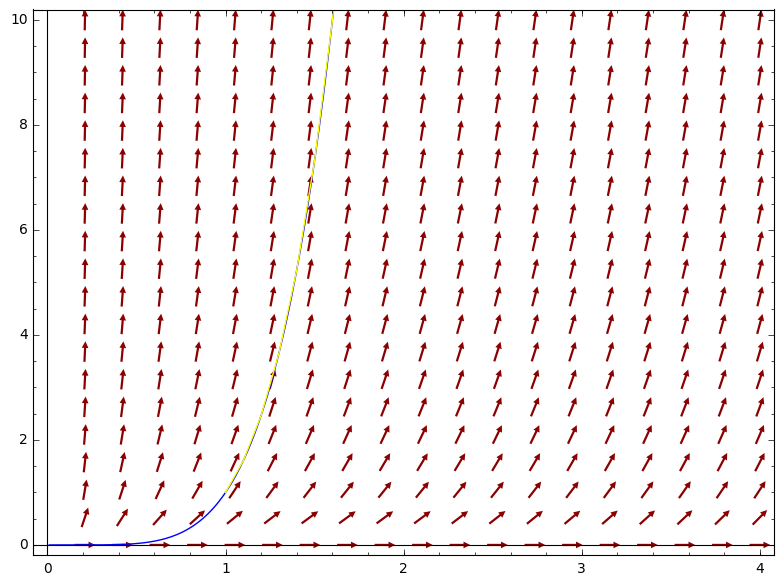
Indeed, the plots overlap.
