Revision history [back]
| | 1 | initial version |

I asked about plotting to high precision on sage-support, and got the a few suggestions. One that works for me is, rather than plot the function, instead generate pairs (a, V(a,1)) and draw the plot connecting those points. Combining this with an appropriate call to numerical_approx (also known as just n) works well:
L = [(a, V(a,1).n(1000)) for a in sxrange(0, 30, 0.01)]
plot(line(L))
generates
| | 2 | No.2 Revision |
I asked about plotting to with high precision on sage-support, and got the a few suggestions. One that works for me is, rather than plot the function, instead generate pairs (a, V(a,1)) and draw the plot connecting those points. Combining this with an appropriate call to numerical_approx (also known as just n) works well:
L = [(a, V(a,1).n(1000)) for a in sxrange(0, 30, 0.01)]
plot(line(L))
generates
| | 3 | No.3 Revision |
I asked about plotting with high precision on sage-support, and got the a few suggestions. One that works for me is, rather than plot the function, instead generate pairs (a, V(a,1)) and draw the plot connecting those points. Combining this with an appropriate call to numerical_approx (also known as just n) works well:
L = [(a, V(a,1).n(1000)) for a in sxrange(0, 30, 0.01)]
plot(line(L))
generates
| | 4 | No.4 Revision |
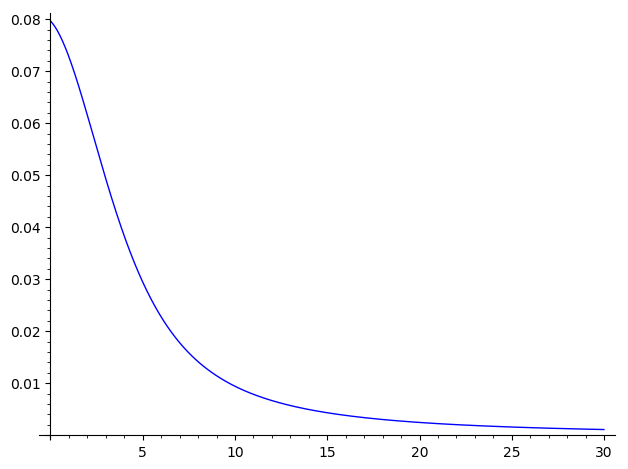
I asked about plotting with high precision on the Google group sage-support and got the a few suggestions. One that works for me is, rather than plot the function, instead generate pairs (a, V(a,1)) and draw the plot connecting those points. Combining this with an appropriate call to numerical_approx (also known as just n) works well:
L = [(a, V(a,1).n(1000)) for a in sxrange(0, 30, 0.01)]
plot(line(L))
generates
| | 5 | No.5 Revision |
I asked about plotting with high precision on the Google group sage-support and got the a few suggestions. One that works for me is, rather than plot the function, instead generate pairs (a, V(a,1)) and draw the plot connecting those points. Combining this with an appropriate call to numerical_approx (also known as just n) works well:
L = [(a, V(a,1).n(1000)) [(x, V(x,1).n(1000)) for a x in sxrange(0, 30, 0.01)]
plot(line(L))
generates
