Revision history [back]
| | 1 | initial version |
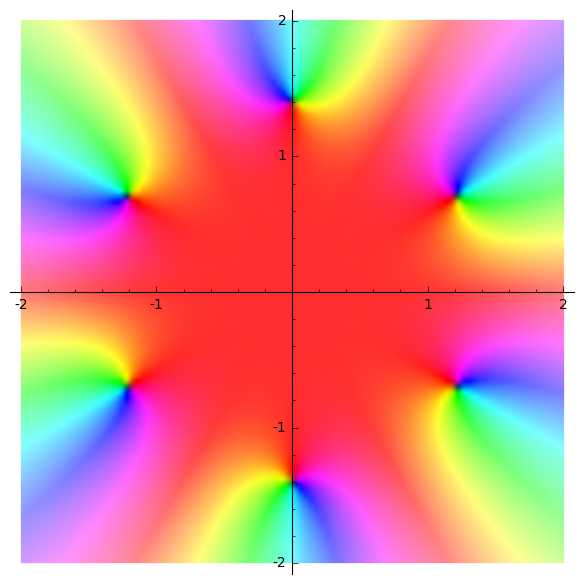
You may also draw a complex plot (black dots are the zeroes, red means real numbers or close to, and other rainbow colors means other argument, more white means high modulus:
sage: var('z')
z
sage: complex_plot(z^6 + 8, (-2,2), (-2,2))
Launched png viewer for Graphics object consisting of 1 graphics primitive
| | 2 | No.2 Revision |
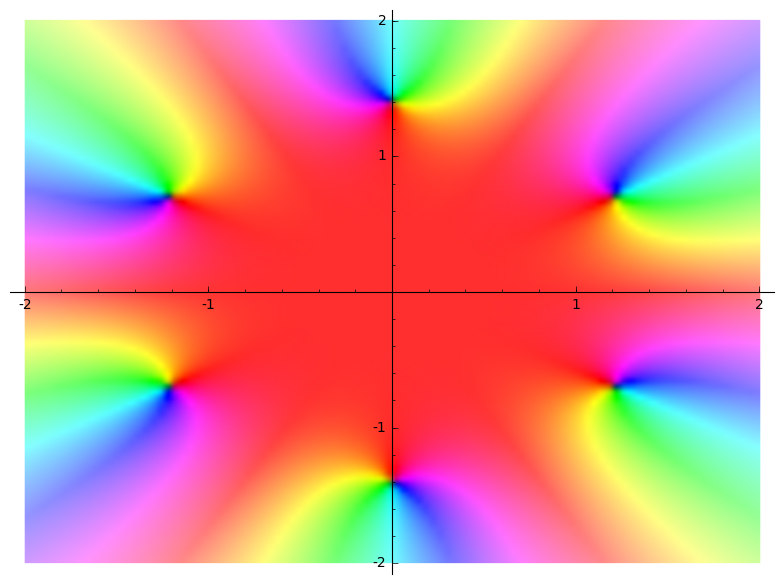
You may also draw a complex plot (black dots are the zeroes, red means real numbers or close to, and other rainbow colors means other argument, more white means high modulus:
sage: var('z')
z
sage: complex_plot(z^6 + 8, (-2,2), (-2,2))
(-2,2), aspect_ratio=1)
Launched png viewer for Graphics object consisting of 1 graphics primitive