Revision history [back]
| | 1 | initial version |

Not entirely sure why you assume v is complex and want to plot it when $v\in [-1,7]$.
Perhaps this is what you want to use (?).
complex_plot(lambda v: abs(matrix(CC, [[0,1,0,0],[-v,1-v,0,0],[0,-v,1-v,0],[0,0,1,0]]).eigenvalues()[0]),(-10,10),(-10,10))
Sample output:
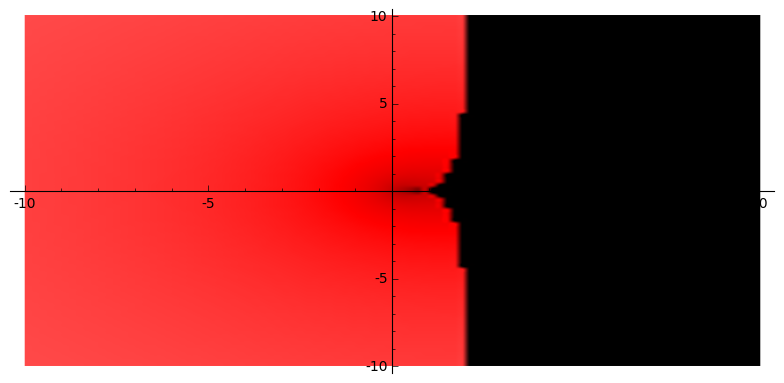
Although, then you may want to drop the abs to get:

| | 2 | No.2 Revision |
Not entirely sure why you assume v is complex and want to plot it when $v\in [-1,7]$.
Perhaps this is what you want to use (?).use.
complex_plot(lambda v: abs(matrix(CC, [[0,1,0,0],[-v,1-v,0,0],[0,-v,1-v,0],[0,0,1,0]]).eigenvalues()[0]),(-10,10),(-10,10))
Sample output:
Although, then you may want to drop the abs to get:
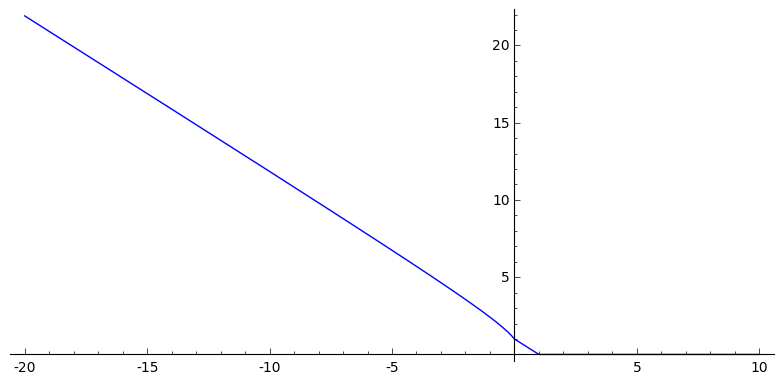
If you are just interested in the case where $v\in \mathbb{R}$ and want to plot the module of the eigenvalue then
plot(lambda v: abs(matrix(CC, [[0,1,0,0],[-v,1-v,0,0],[0,-v,1-v,0],[0,0,1,0]]).eigenvalues()[0]),(x,-20,10))
will do the job.
Update: Added case where $v\in[1,7]$.
| | 3 | No.3 Revision |
Perhaps this is what you want to use.
complex_plot(lambda v: abs(matrix(CC, [[0,1,0,0],[-v,1-v,0,0],[0,-v,1-v,0],[0,0,1,0]]).eigenvalues()[0]),(-10,10),(-10,10))
Sample output:
Although, then you may want to drop the abs to get:
If you are just interested in the case where $v\in \mathbb{R}$ and want to plot the module of the eigenvalue then
plot(lambda v: abs(matrix(CC, [[0,1,0,0],[-v,1-v,0,0],[0,-v,1-v,0],[0,0,1,0]]).eigenvalues()[0]),(x,-20,10))
will do the job.
Update: Added case where $v\in[1,7]$.$v\in\mathbb{R}$.
