Revision history [back]
 | 1 | initial version |
Maybe you can try something of the form
pts=[[1,2,3],[1,1,1],[2,3,0]]
line3d(pts,color='red')+point3d(pts,color='blue')
You will probably need to plot each of the line segments separately.
 | 2 | No.2 Revision |
Maybe you can try something of the form
pts=[[1,2,3],[1,1,1],[2,3,0]]
line3d(pts,color='red')+point3d(pts,color='blue')
# list of points
pts = [(0, 0, 0), (1, 0, 0), (1, 1, 0), (1, 1, 1), (2, 1, 1), (2, 2, 1), (2, 2, 2), (3, 2, 2), (3, 3, 2), (3, 3, 3), (4, 3, 3), (4, 4, 3), (4, 4, 4), (5, 4, 4), (5, 5, 4), (5, 5, 5), (6, 5, 5), (6, 6, 5), (6, 6, 6), (7, 6, 6), (7, 7, 6)]

# some red segments
red_segments = ('red',[[pts[i],pts[i+1]] for i in range(len(pts)-1) if i%3==0])
# some green segments
green_segments = [[pts[i],pts[i+1]] for i in range(len(pts)-1) if i%3==1]
# some blue segments
blue_segments = [[pts[i],pts[i+1]] for i in range(len(pts)-1) if i%3==2]

# empty graphics object
P=Graphics()

for rs in red_segments:
    P += line3d(rs,color='red')
for gs in green_segments:
    P += line3d(gs,color='green')
for bs in blue_segments:
    P += line3d(bs,color='blue')

P+=point3d(pts,color='black')
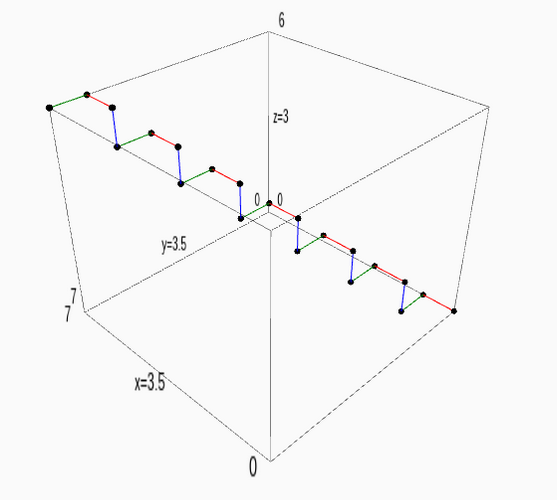
You will probably need to plot each of the line segments separately.Sample output (using P.show()).

 | 3 | No.3 Revision |
Maybe you can try something of the form
# list of points
pts = [(0, 0, 0), (1, 0, 0), (1, 1, 0), (1, 1, 1), (2, 1, 1), (2, 2, 1), (2, 2, 2), (3, 2, 2), (3, 3, 2), (3, 3, 3), (4, 3, 3), (4, 4, 3), (4, 4, 4), (5, 4, 4), (5, 5, 4), (5, 5, 5), (6, 5, 5), (6, 6, 5), (6, 6, 6), (7, 6, 6), (7, 7, 6)]

# some red segments
red_segments = ('red',[[pts[i],pts[i+1]] [[pts[i],pts[i+1]] for i in range(len(pts)-1) if i%3==0])
i%3==0]
# some green segments
green_segments = [[pts[i],pts[i+1]] for i in range(len(pts)-1) if i%3==1]
# some blue segments
blue_segments = [[pts[i],pts[i+1]] for i in range(len(pts)-1) if i%3==2]

# empty graphics object
P=Graphics()

for rs in red_segments:
    P += line3d(rs,color='red')
for gs in green_segments:
    P += line3d(gs,color='green')
for bs in blue_segments:
    P += line3d(bs,color='blue')

P+=point3d(pts,color='black')
Sample output (using P.show()).

Update: Removed bug on 2nd line of code.
 | 4 | No.4 Revision |
Maybe you can try something of the form
# list of points
pts = [(0, 0, 0), (1, 0, 0), (1, 1, 0), (1, 1, 1), (2, 1, 1), (2, 2, 1), (2, 2, 2), (3, 2, 2), (3, 3, 2), (3, 3, 3), (4, 3, 3), (4, 4, 3), (4, 4, 4), (5, 4, 4), (5, 5, 4), (5, 5, 5), (6, 5, 5), (6, 6, 5), (6, 6, 6), (7, 6, 6), (7, 7, 6)]

# some red segments
red_segments = [[pts[i],pts[i+1]] for i in range(len(pts)-1) if i%3==0]
# some green segments
green_segments = [[pts[i],pts[i+1]] for i in range(len(pts)-1) if i%3==1]
# some blue segments
blue_segments = [[pts[i],pts[i+1]] for i in range(len(pts)-1) if i%3==2]

# empty graphics object
P=Graphics()

for rs in red_segments:
    P += line3d(rs,color='red')
for gs in green_segments:
    P += line3d(gs,color='green')
for bs in blue_segments:
    P += line3d(bs,color='blue')

P+=point3d(pts,color='black')
P
Sample output (using P.show()).

Update: Removed bug on 2nd line of code.
 | 5 | No.5 Revision |
Maybe you can try something of the form
# list of points
pts = [(0, 0, 0), (1, 0, 0), (1, 1, 0), (1, 1, 1), (2, 1, 1), (2, 2, 1), (2, 2, 2), (3, 2, 2), (3, 3, 2), (3, 3, 3), (4, 3, 3), (4, 4, 3), (4, 4, 4), (5, 4, 4), (5, 5, 4), (5, 5, 5), (6, 5, 5), (6, 6, 5), (6, 6, 6), (7, 6, 6), (7, 7, 6)]

# some red segments
red_segments = [[pts[i],pts[i+1]] for i in range(len(pts)-1) if i%3==0]
# some green segments
green_segments = [[pts[i],pts[i+1]] for i in range(len(pts)-1) if i%3==1]
# some blue segments
blue_segments = [[pts[i],pts[i+1]] for i in range(len(pts)-1) if i%3==2]

# empty graphics object
P=Graphics()

for rs in red_segments:
    P += line3d(rs,color='red')
for gs in green_segments:
    P += line3d(gs,color='green')
for bs in blue_segments:
    P += line3d(bs,color='blue')

P+=point3d(pts,color='black')
P
Sample output:

Update: Removed bug on 2nd line of code.code and added a last line (curiously P.show() does not actually show the plot in cloud.sagemath.com).

