Ask Your Question

Revision history [back]

click to hide/show revision 1
initial version

integral of function with sgn (x,I) inside

HI

I encounter a problem on an integral calculation, and I do not know how to find a workaround. (I mean a mathematically correct workaround, not the questionable tinkering of replacing SGN (f (x, I)) by -1 !!! that I did to get a numeric value ;-) ). if I comment out lines (77,78) and (128,129) I get an error:

ValueError: The function to be integrated depends on 2 variables (x, z), and so cannot be integrated in one dimension. Please fix additional variables with the 'params' argument

Does somebody knows what 'params' I must set in function numerical_integral ? code on sagecell

show("###########################################################") 
show("Compute Surface of the spherical triangle and XY plan") 
show("###########################################################") 
var('x,y')
rNum=1

var('xLow,xUp,yLow,yUp')

# rounding values
PtsL=       [[0.13795, 0.37902], [0.33554, 0.92189], [0.84803, 0.2028], [0.80141, 0.37902]]
PtsNamesL = [      'xy01',            'xy12',              'xy02',          'xyCut']

ellipse0 = 1/2*sqrt(-x^2 + 1)*sqrt(-sqrt(2) + 2)
ellipse1 = x*cos(1/9*pi)/sin(1/9*pi)
ellipse2 = sqrt(-4/3*x^2 + 1)

plt = list_plot(PtsL, color='blue', size=30)
pt_opt = {'color': 'blue', 'horizontal_alignment': 'left', 'vertical_alignment': 'bottom'}
plt += sum(text(name, vector(pt), **pt_opt) for name, pt in zip(PtsNamesL, PtsL))
plt += line([[0, PtsL[3][1]], PtsL[3]], color='brown', thickness=2, linestyle='dashed')
plt += line([[PtsL[1][0], 0], PtsL[1]], color='blue', thickness=2, linestyle='dashed')
plt+=implicit_plot(ellipse0-y,(x,0,1),(y,0,1),color='orange')
plt+=plot(ellipse1,(x,0.1,PtsL[1][0]),color='yellow')
plt+=implicit_plot(ellipse2-y,(x,0,1),(y,0,1),color='green')


rS(x,y,z)=(x,y,sqrt(rNum^2-x^2-y^2))
rSdx=diff(rS,x,1)
rSdy=diff(rS,y,1)
assume(0<x<1)
assume(0<y<1)
assume(rNum^2-x^2-y^2 >0)

show("r diff x : ",rSdx," \t r diff y : ",rSdy)
rSds=(vector(rSdx).cross_product(vector(rSdy)))
# I don't use rSds.norm(),because it is adding abs function
# because for us R^2-x^2-y^2 >=0 
dsNorm=sqrt(rSds[0]^2+rSds[1]^2+rSds[2]^2)
show("ds : ",rSds," \t norm : ",dsNorm)

show("order of integration, Y,X : FIRST part, left side of the blue line ")

Pxy0 = plt
Pxy0+= plot([ellipse0, ellipse1], (PtsL[0][0], PtsL[1][0]), fill={0: [1]}, fillcolor='#ccc', fillalpha=.3)
Pxy0+=implicit_plot(ellipse0-y,(x,0,1),(y,0,1),color='orange')
Pxy0+=plot(ellipse1,(x,(PtsL[0][0]),(PtsL[1][0])),color='yellow')
Pxy0+=implicit_plot(ellipse2-y,(x,0,1),(y,0,1),color='green')
Pxy0.show(xmin=0, xmax=1, ymin=0, ymax=1, aspect_ratio=1, figsize=8)

show("first piece delimited by yellow curve ,orange curve and blue line in xy plan")

eqLimitL=[]


eqLimitL.append(yLow==ellipse0)
eqLimitL.append(yUp==ellipse1)

eqLimitL.append(xLow==PtsL[0][0])
eqLimitL.append(xUp==PtsL[1][0])


arrondi=10
# spherical triangle partaged in two pieces
# first piece delimited by yellow curve ,orange curve and blue line in xy plan
show(LatexExpr(r"\text{surface of first piece of spherical Triangle} \,=\,"
+r"\int_{"+latex(eqLimitL[0])+"}^{"+latex(eqLimitL[1])+"} " \
+r"\int_{xLow="+latex(round(eqLimitL[2].rhs(),arrondi))+"}^{xUp="+latex(round(eqLimitL[3].rhs(),arrondi))+"} " \
#+r", "+latex(rS[2])+latex(dsNorm)+r" \, \, dy \, dx"))
+r", "+latex(dsNorm)+r" \, \, dy \, dx"))

intY0=(integrate(dsNorm,y,eqLimitL[0].rhs(),eqLimitL[1].rhs(),algorithm="giac"))
print(intY0)

intY00=intY0
#show(" below we replace sgn function by fsgn(x)=-1 because numerical_integral can't integrate with sgn ")
fsgn(x)= -1
intY00=intY0.substitute_function(sgn,fsgn)

show("intY0 with sgn Function: ", intY0)
show("intY00 subs of sgn: ", intY00)
intYX00=numerical_integral(intY00,eqLimitL[2].rhs(),eqLimitL[3].rhs())
show("First spherical surface  piece after numerical integration : ", intYX00)


var('xLow,xUp,yLow,yUp',domain='real')
show("order of integration, Y,X : Second part, rigth side of the blue line ") 

Pxy1 = plt
Pxy1+= plot([ellipse0, ellipse2], (PtsL[1][0], PtsL[2][0]), fill={0: [1]}, fillcolor='#ccc', fillalpha=.3)
Pxy1+=implicit_plot(ellipse0-y,(x,0,1),(y,0,1),color='orange')
Pxy1+=plot(ellipse1,(x,PtsL[0][0],PtsL[1][0]),color='yellow')
Pxy1+=implicit_plot(ellipse2-y,(x,0,1),(y,0,1),color='green')
Pxy1.show(xmin=0, xmax=1, ymin=0, ymax=1, aspect_ratio=1, figsize=8)


eqLimitL=[]
# delimited y area
#assume(PtsL[2][1]<=ellipse0 <=PtsL[1][1])
#assume(PtsL[2][1]<=ellipse2 <=PtsL[1][1])
# delimited x area
eqLimitL.append(yLow==ellipse0)
eqLimitL.append(yUp==ellipse2)

eqLimitL.append(xLow==PtsL[1][0])
eqLimitL.append(xUp==PtsL[2][0])


arrondi=10
# spherical triangle partaged in two pieces
# Second piece delimited by blue line ,orange curve and green curve in xy plan
show(LatexExpr(r"\text{surface of second piece of spherical Triangle} \,=\,"
+r"\int_{"+latex(eqLimitL[0])+"}^{"+latex(eqLimitL[1])+"} " \
+r"\int_{xLow="+latex(round(eqLimitL[2].rhs(),arrondi))+"}^{xUp="+latex(round(eqLimitL[3].rhs(),arrondi))+"} " \
#+r", "+latex(rS[2])+latex(dsNorm)+r" \, \, dy \, dx"))
+r", "+latex(dsNorm)+r" \, \, dy \, dx"))

#intY1=(integrate(dsNorm,y,eqLimitL[0].rhs(),eqLimitL[1].rhs(),algorithm="giac"))
intY1=(integrate(dsNorm,y,yLow,yUp,algorithm="giac"))
print(intY1)
intY11=intY1.subs(eqLimitL)
show("intY1 : ",intY11)
intY111=intY11
#show(" below we replace sgn function by fsgn(x)=-1 because numerical_integral can't integrate with sgn ")
fsgn(x)= -1
intY111=intY11.substitute_function(sgn,fsgn)


show("intY11 with sgn Function: ", intY11)
show("intY111 subs of sgn: ", intY111)
intYX111=numerical_integral(intY111,eqLimitL[2].rhs().n(),eqLimitL[3].rhs().n())
show("Second spherical surface piece after numerical integration : ", intYX111)
show("total Triangle area Computed by surface integration: ", intYX00[0]+intYX111[0])
#show('Total TriAngle Area Computed with Harriot Theorem : ',HarriotArea,' \t with R = ',rNum)
#show(" We can also verify the computation in multiplying the radius by 2(rNum at top of the file)")
#show(" and check that the surface is multiplied by 2^2=4 and the volume by 2^3=8")
#show(" you can also check the computation by changing the spherical surface with the condition,")
#show(" that this surface should be contained in first octant ")
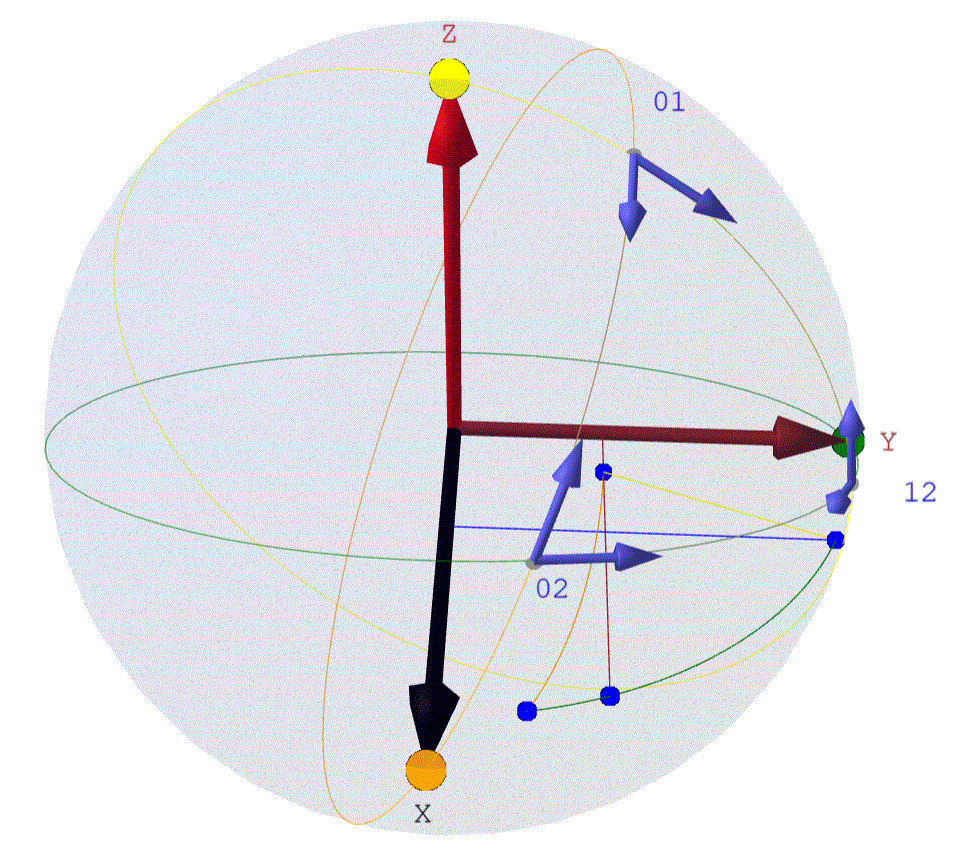

sphere 3D