Spectral density of a signal

Hello!
Could somebody please help me find a way to build the spectral density function for a given signal in Sage?
Thank you!
add a comment
Hello!
Could somebody please help me find a way to build the spectral density function for a given signal in Sage?
Thank you!
A self-answer:
The power spectral density (PSD) may be defined as
$ S(\omega) = \lim \limits_{T \to +\infty} \frac{\left \vert F_T(\omega) \right \vert ^2}{T} $,
where $ F_T (\omega)$ is the Fourier transform defined as follows:
$ {F}_T(\omega) = \int \limits_0^T f(t) \exp(-i\omega t) ~ dt$
def PSD(time_series):
    import scipy

    signal_length = n(len(time_series)*(time_series[1][0]-time_series[0][0]))
    signal_fft = scipy.fft(zip(*time_series)[1])

    spectrum = []
    for i in range(len(signal_fft)//2):
        spectrum.append((i/signal_length,abs(signal_fft[i])**2/len(time_series)))
    return spectrum
The accepted data set format is:
data = [(t1,y1),(t2,y2),...,(tn,yn)]
Calling
PSD(data)
for such signal will return the Power Spectral Density of a signal.
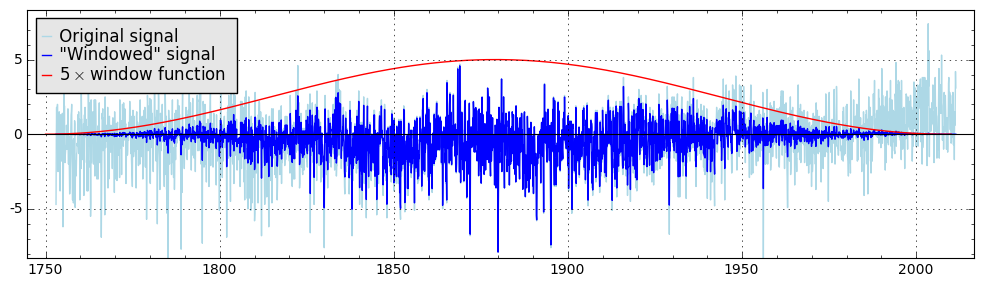
Sometimes it is useful to apply some kind of window function to a signal prior to calculating the PSD, since the sharp start and end of the data record may produce some spurious spectral components.
Here is an example of the popular Hanning Window application for the time series:
def hanning_window(time_series):
    ''' Applies Hanning window to the time series.
    Accepted data format is a list of tuples [(x1,y1),(x2,y2),...]'''

    series_length = n(len(time_series))
    processed_signal=[]
    for i in range(len(time_series)):
        processed_signal.append((time_series[i][0], n(time_series[i][1] * \
                                 (0.5*(1 - cos(2*pi*i/(series_length-1)))))))

    return processed_signal
The result of its application looks like this:
One can simply call
PSD(hanning_window(data))
to get the power spectral density for a data set with Hanning window function applied.
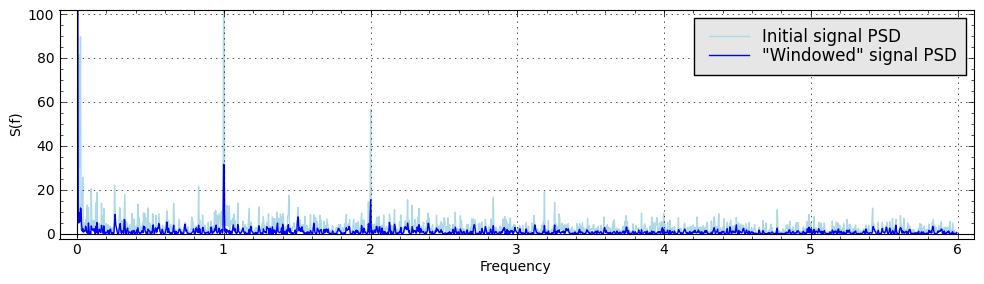
You can compare the results of spectral density calculation for the initial time series and "windowed" time series:
Please start posting anonymously - your entry will be published after you log in or create a new account.
Asked: 2012-07-17 09:48:47 +0200
Seen: 1,036 times
Last updated: Jul 03 '15
 Copyright Sage, 2010. Some rights reserved under creative commons license. Content on this site is licensed under a Creative Commons Attribution Share Alike 3.0 license.