Ask Your Question
1

contour_plot behaves differently when I include the functional dependence

asked 2024-05-02 17:34:30 +0200

thethinker gravatar image

If I include the functional dependence of my function, the contour_plot routine behaves differently. MWE:

var('x y')
def check(x,y):
    val=-1. # negative by default, 
    for j in range(1,10): 
        for i in range(1,10): 
            if ( ( (x>0.9*i) and (x<1.1*i) ) and ( (y>0.9*j) and (y<1.1*j) ) ):
                val=1.
    return val

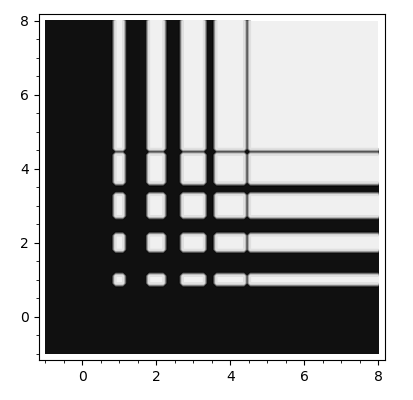
So this is kind of a strange function, but basically if (x,y) are near any of the 2d grid points (1-10), the function is 1 instead of zero. If I call this function without specifying the functional dependence, it looks right:

contour_plot(check,(x,-1.,8.),(y,-1.,8.))

image description

However, if I call them and specify them explicitly, I get the unexpected (to me):

contour_plot(check(x,y),(x,-1.,8.),(y,-1.,8.))

image description

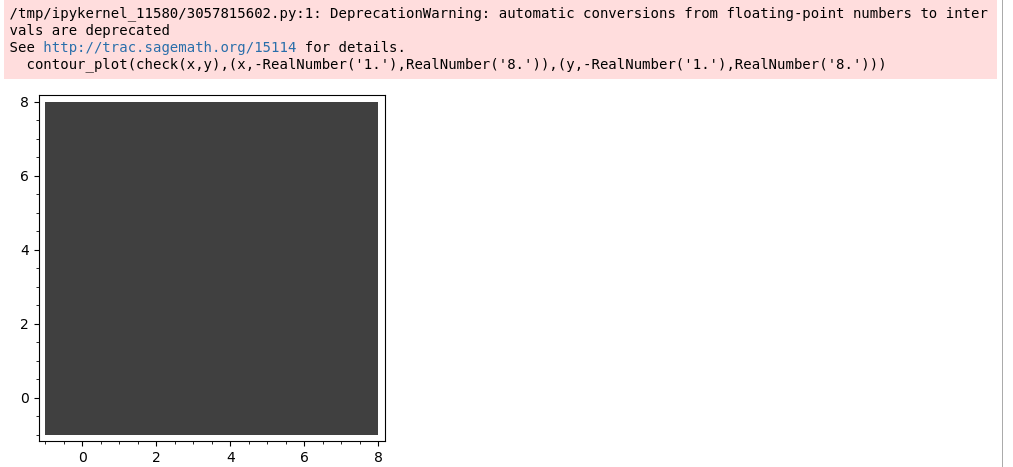
(I grabbed the depreciation warning too, although I don't see how it matters here).

This is not just academic, because what I really want to do is have a four-variable funcftion, a la

def h(x,y,z,w):
...

and do a contour plot on two variables, setting the other two constant, like

contour_plot(h(x,y,0,1),....)

I'm having trouble, and trying to debug. Any thoughts?

edit retag flag offensive close merge delete

1 Answer

Sort by ยป oldest newest most voted
1

answered 2024-05-05 16:43:42 +0200

eric_g gravatar image

updated 2024-05-05 16:46:06 +0200

The issue with contour_plot(check(x, y), (x, -1., 8.), (y, -1., 8.)) arises because check is a Python function, not a symbolic function: Sage first applies the function check to the pair of symbolic variables (x,y), which always returns -1. (because any of the tests of the type x>... returns False for the generic symbolic variable x). The constant output -1. is then passed to the function contour_plot, which explains the uniformly black figure.

To perform a contour plot of h(x, y, 0, 1), where h is a Python function with 4 arguments, use a Python lambda function to transform it into a function of two arguments:

contour_plot(lambda x, y: h(x, y, 0, 1), (-1.,8.), (1.,8.))

For more details, see the section Symbolic functions versus Python functions of the notebook 2-dimensional plots of functions with SageMath.

edit flag offensive delete link more

Your Answer

Please start posting anonymously - your entry will be published after you log in or create a new account.

Add Answer

Question Tools

1 follower

Stats

Asked: 2024-05-02 17:34:30 +0200

Seen: 77 times

Last updated: May 05